This website will be decommissioned as of December 31, 2025.
Archived information will remain available through the following resources:
- Science Briefs: Institute for Pandemics – Ontario COVID-19 Science Advisory Table Science Briefs Archive
- Full Website Archive: University of Toronto Archive
We encourage you to bookmark these links for future reference. If you have any questions, please contact communications@oahpp.ca.
Ontario dashboard.
NOTICE
As of September 8, 2022, this Dashboard is no longer updated. For more information on where you can find equivalent COVID-19 data and information, read the COVID-19 Indicator Roadmap.
View Count: 3217685
Current Status in Ontario
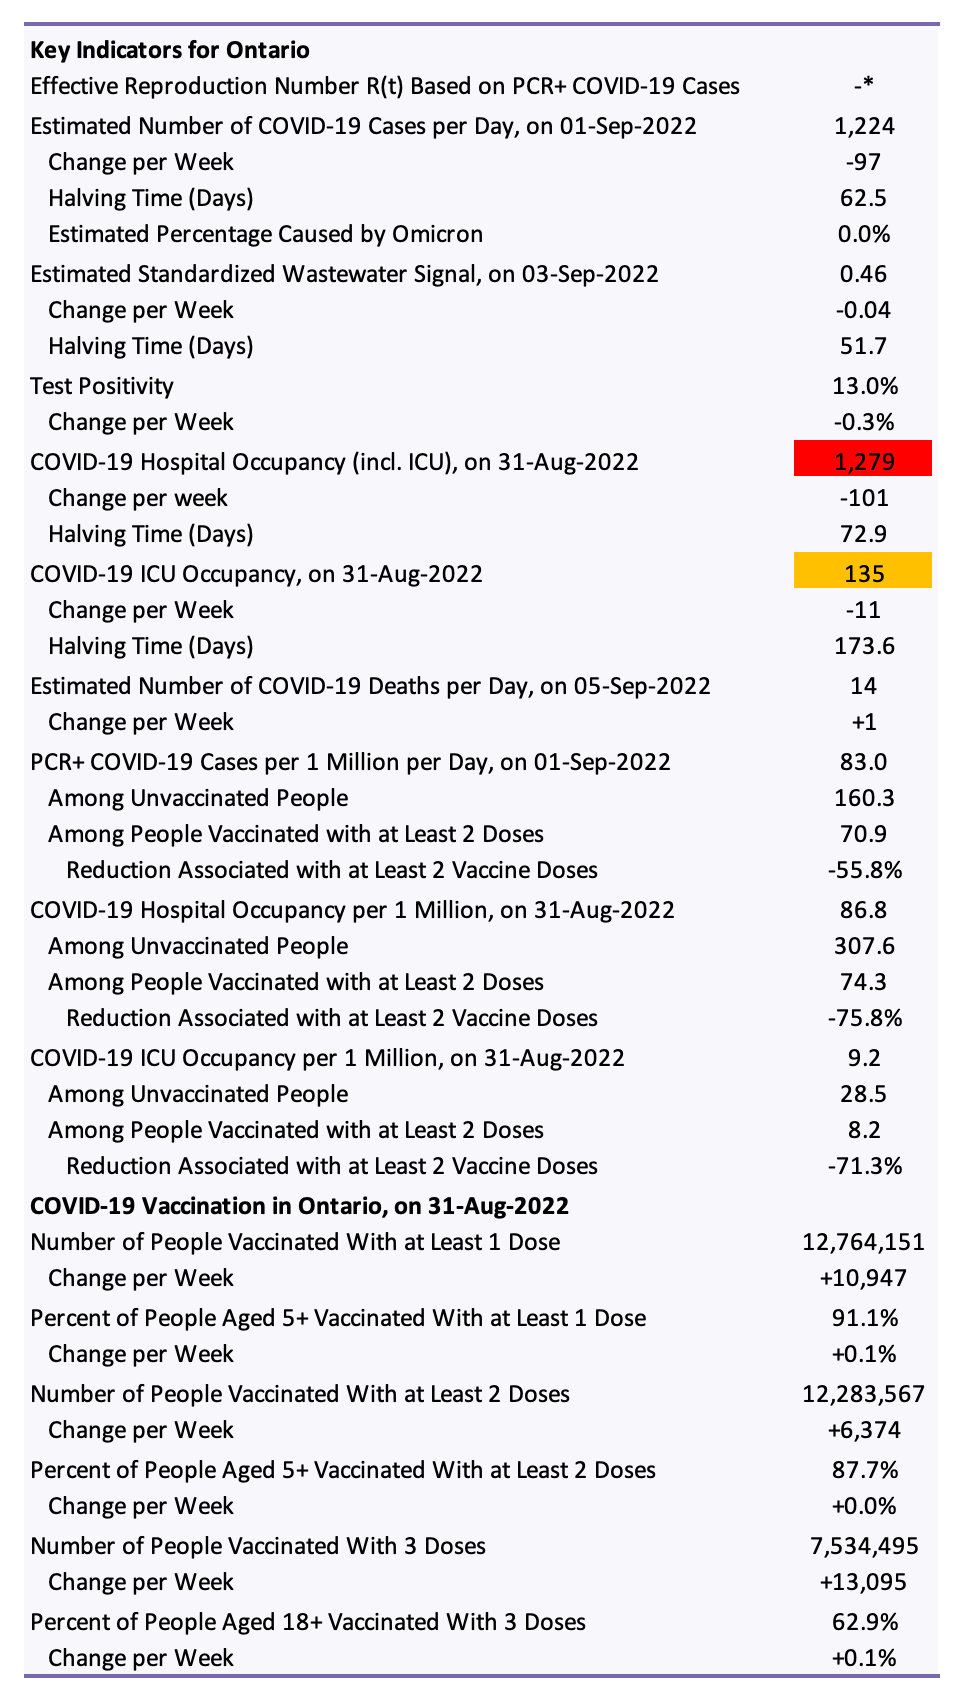
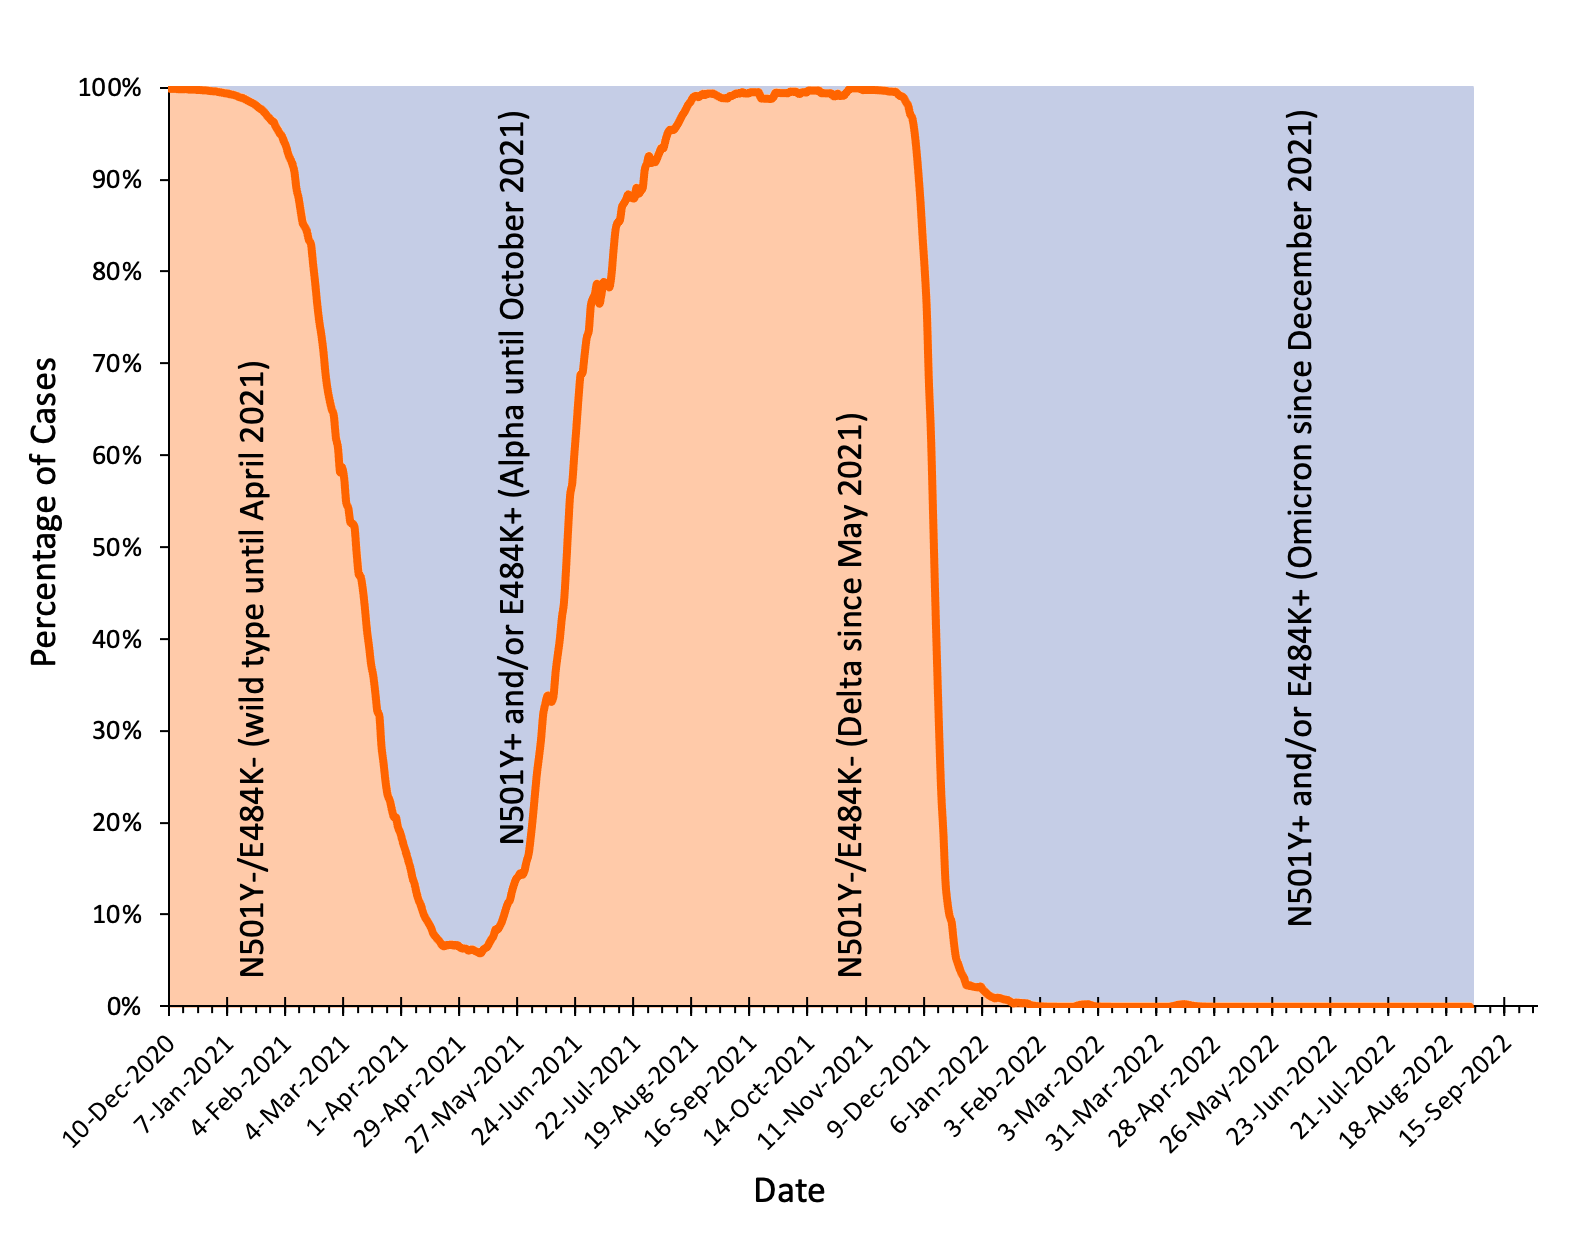
The variants with N501Y mutation (N501Y+) include Alpha, Beta, Gamma and Omicron; the variants with E484K mutation (E484K+) include Beta and Gamma; Omicron is the most frequent N501Y+ variant in Ontario now. The variants without N501Y mutation (N501Y-) and without E484K mutation (E484K-) include Delta (B.1.617.2); the Wild Type was the most frequent N501Y-/E484K- variant until April 2021, Delta is the most frequent N501Y-/E484K- variant in Ontario now.
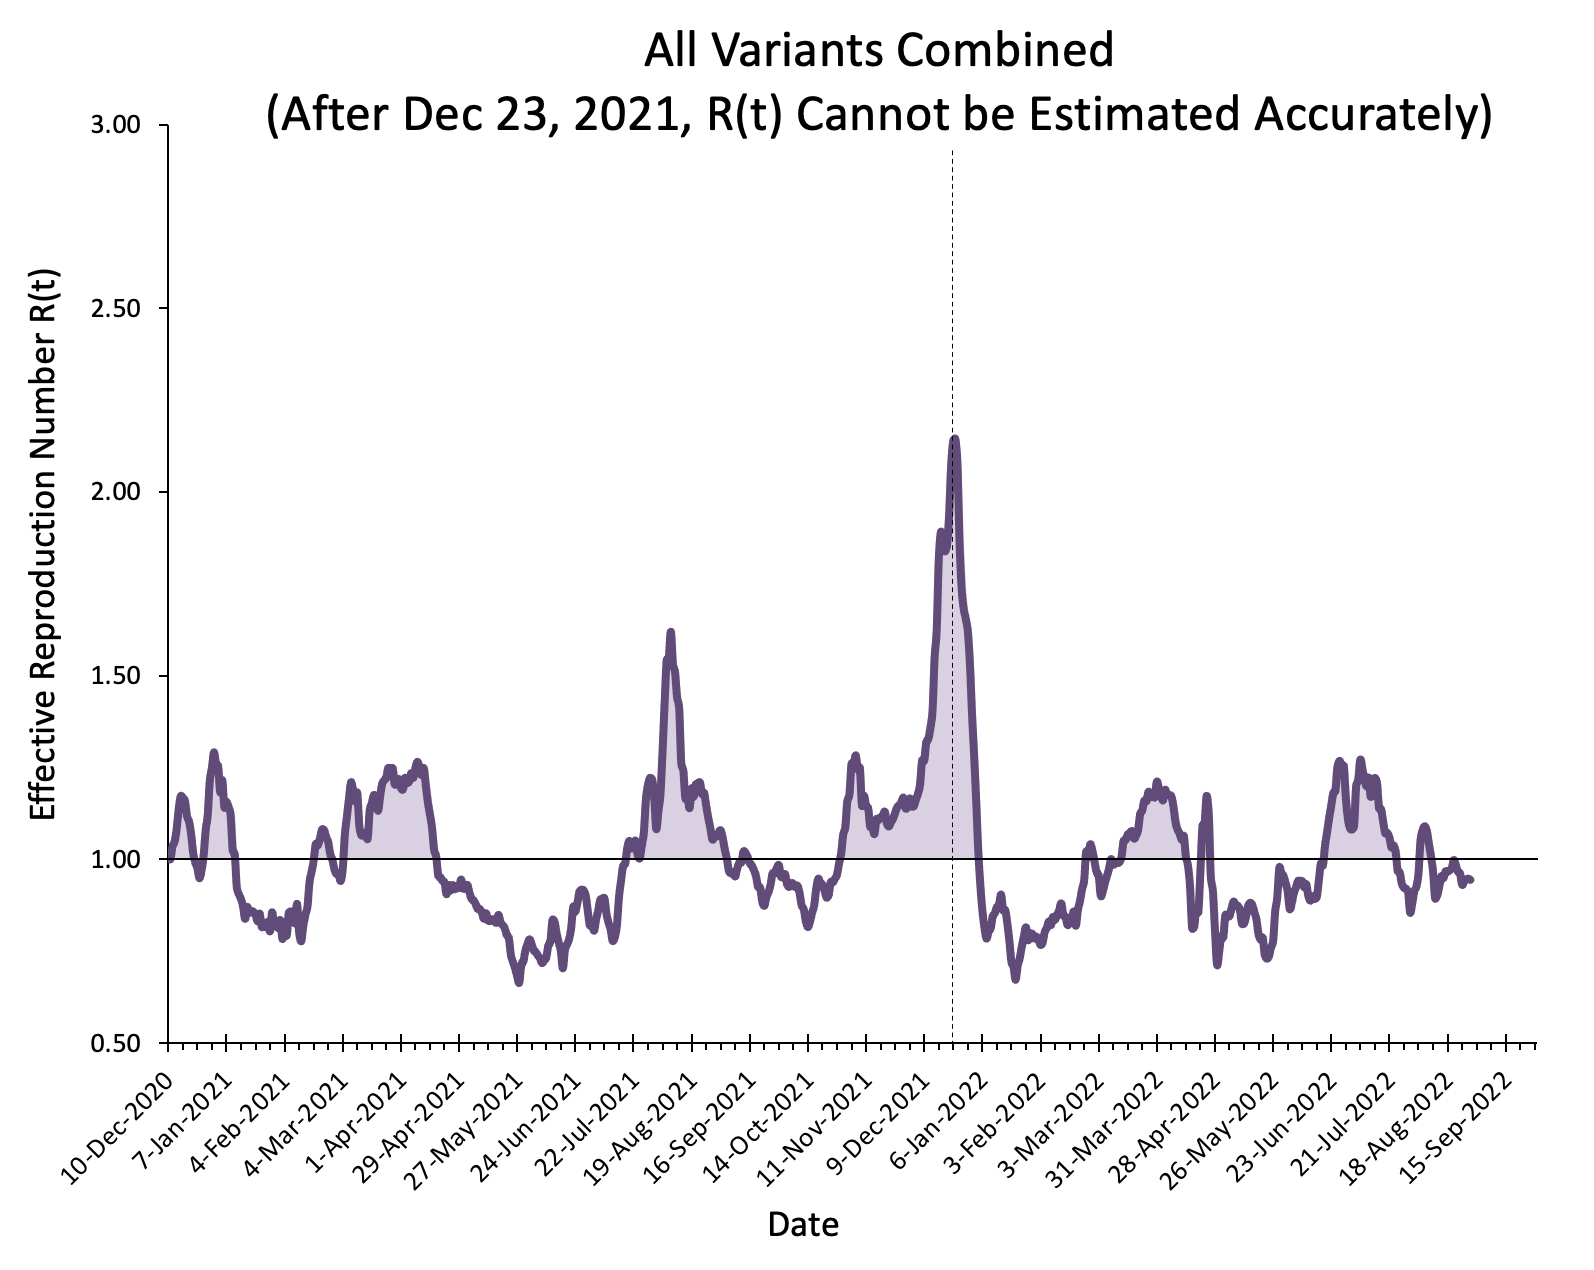
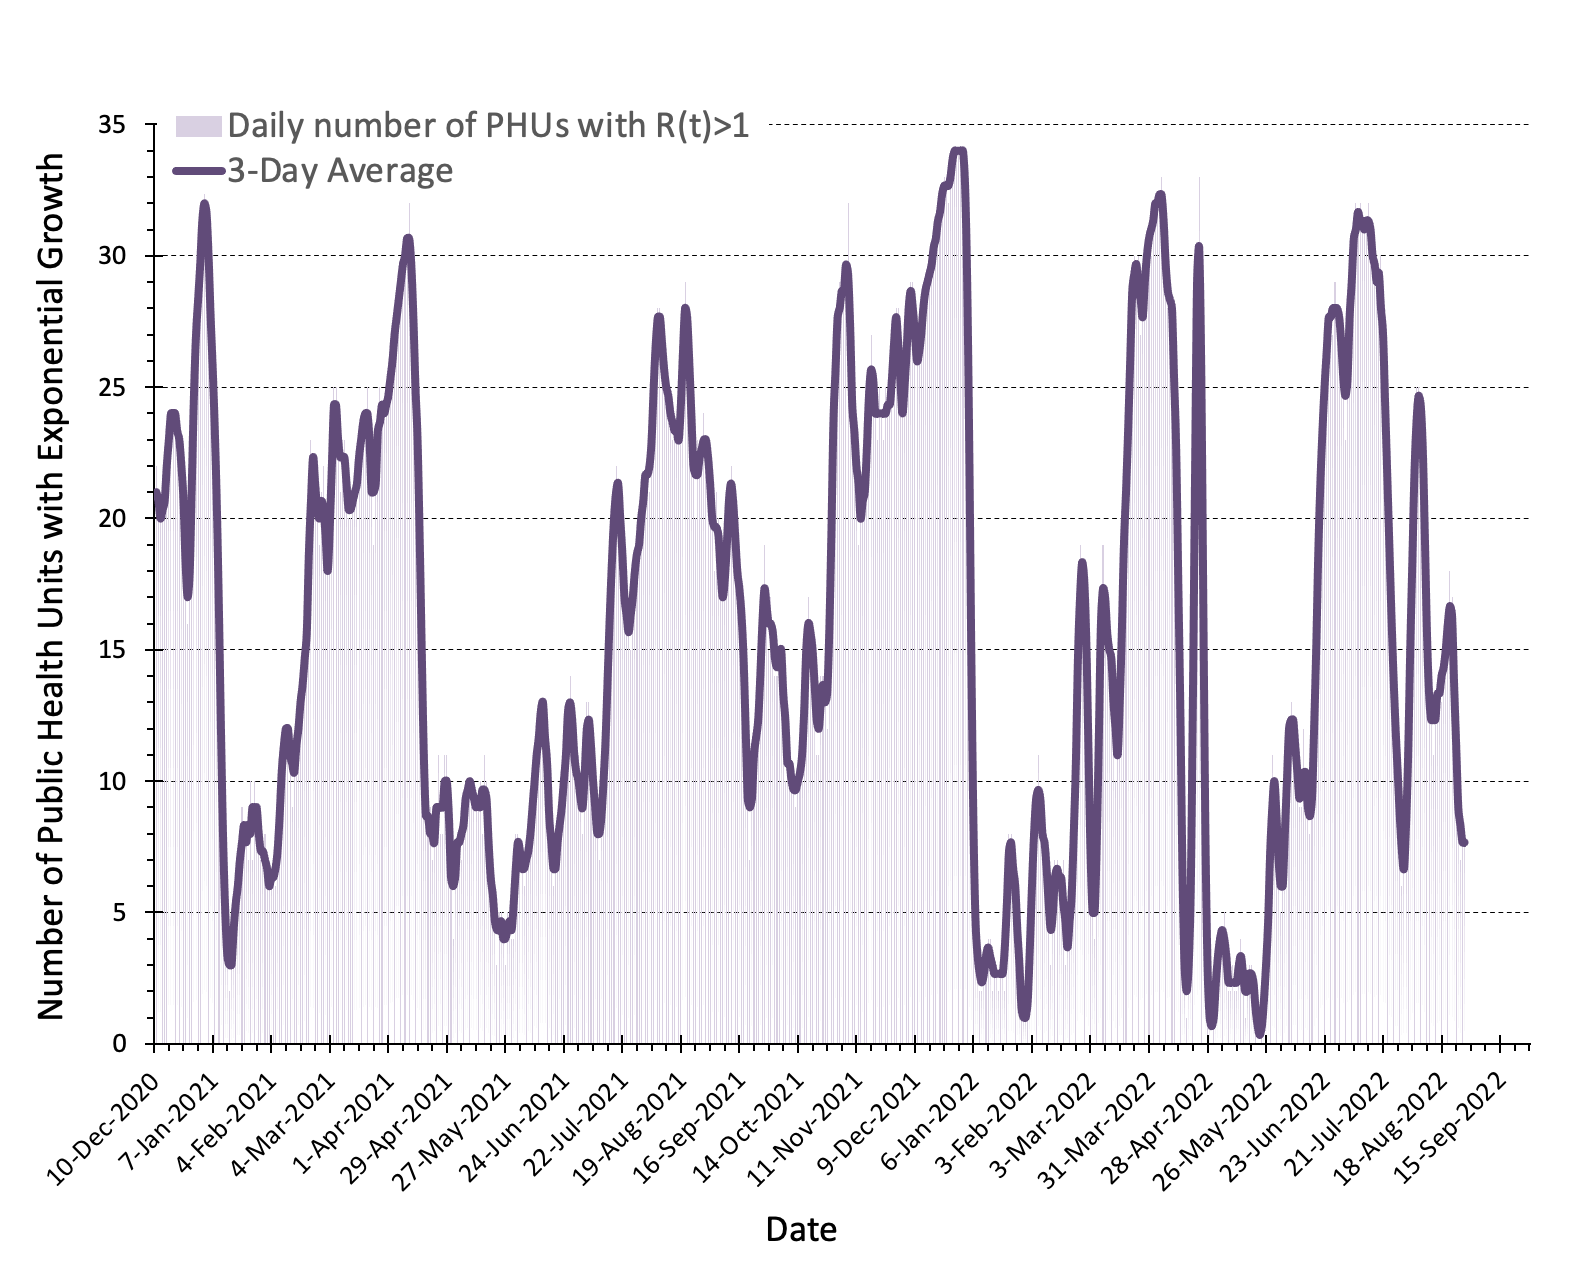
The effective reproduction number R(t) corresponds to the average number of additional infections caused by 1 infection. An R(t) of greater than 1 indicates exponential growth. Change per week is the change as compared with 7 days previously. The doubling time is the estimated time required in days until the current number of cases or the wastewater signal doubles, the halving time is the estimated time required in days until the current number of cases or the wastewater signal halves.
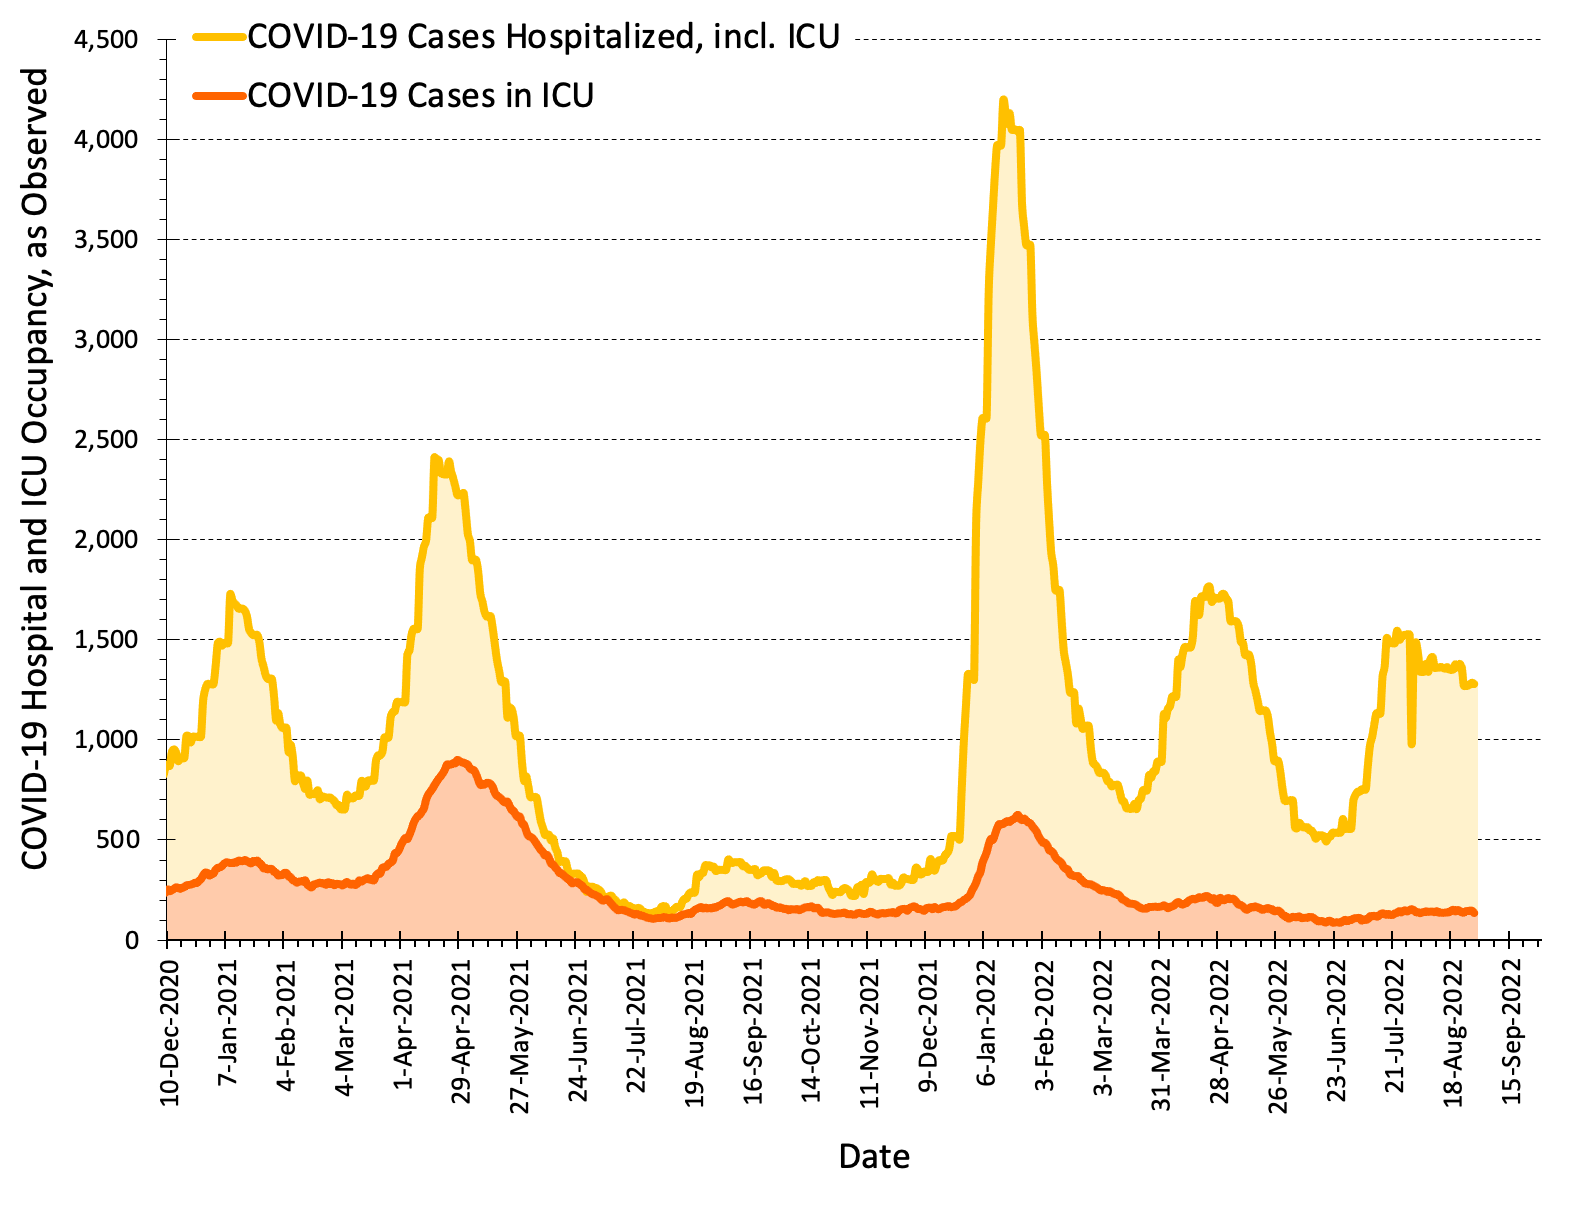
Estimates by vaccination status are age-standardized using Ontario’s current population and a single age cut-off to take into account differences in vaccine uptake and the risk of severe disease between children, adolescents and young adults (0-29 years) and remaining adults (30+ years). The currently available data do not allow for a more granular age standardization. Estimates are based on (1) 7-day averages of the proportions of fully vaccinated and unvaccinated patients hospitalized on wards and ICUs reported in Ontario’s daily surveys, and of fully vaccinated and unvaccinated cases; (2) on COVID-19 hospital and ICU occupancy and the 7-day average of COVID-19 cases in Ontario; and (3) on Ontario’s age-specific vaccination data 7 days before. Hospital occupancy includes patients in ICU. All estimates are updated daily.
Colour codes are adapted from Ontario’s original COVID-19 response framework: green – prevent; yellow – protect; orange – restrict; red – control.
*Currently, R(t) based on cases cannot be estimated accurately because the testing capacity in Ontario is insufficient to deal with the number of infections caused by Omicron, and the testing strategy has changed.
Contents
Current COVID-19 Risk in Ontario by Vaccination Status
COVID-19 Wastewater Signals in Ontario
Estimated Rate of COVID-19 Cases per 1 Million Inhabitants per Day in Ontario
Test Positivity and Number of COVID-19 Tests in Ontario
Effective Reproduction Number R(t) in Ontario
Percentage of Cases Caused by Different Variants in Ontario
Number of Public Health Units With Exponential Growth in Ontario
Daily COVID-19 Hospital and ICU Occupancy in Ontario
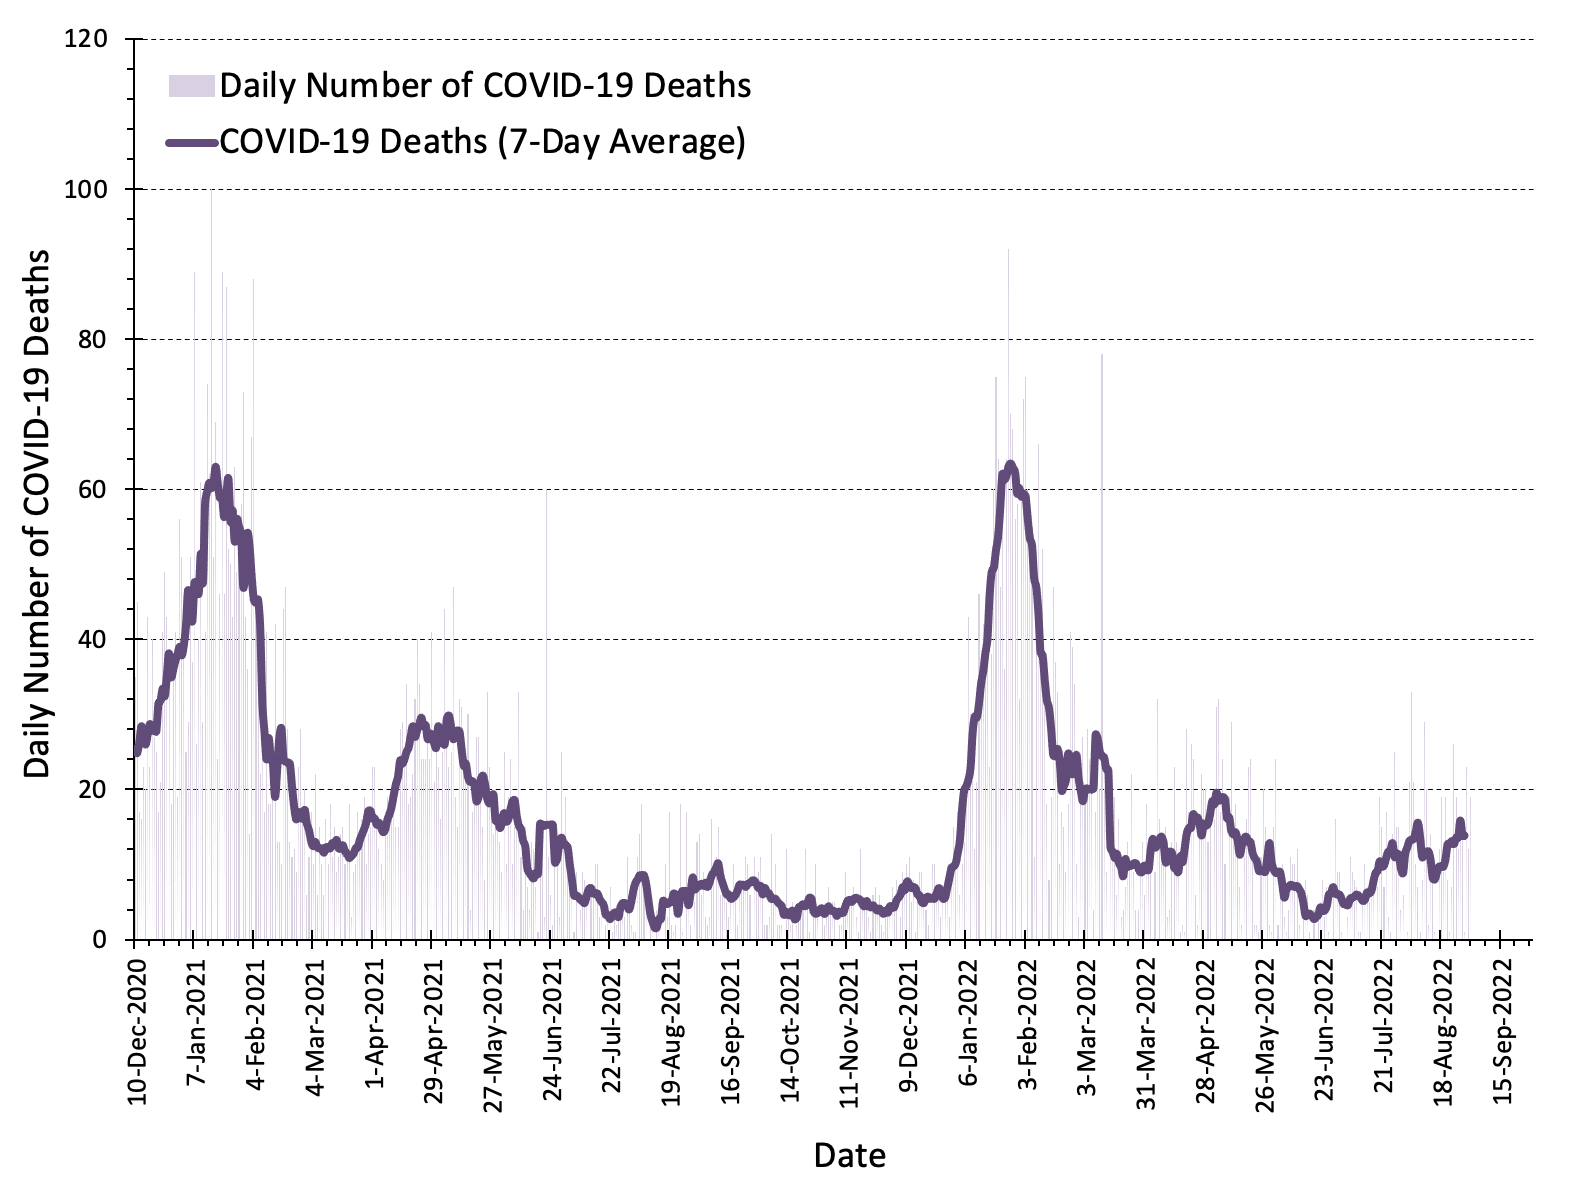
Daily COVID-19 Deaths in Ontario
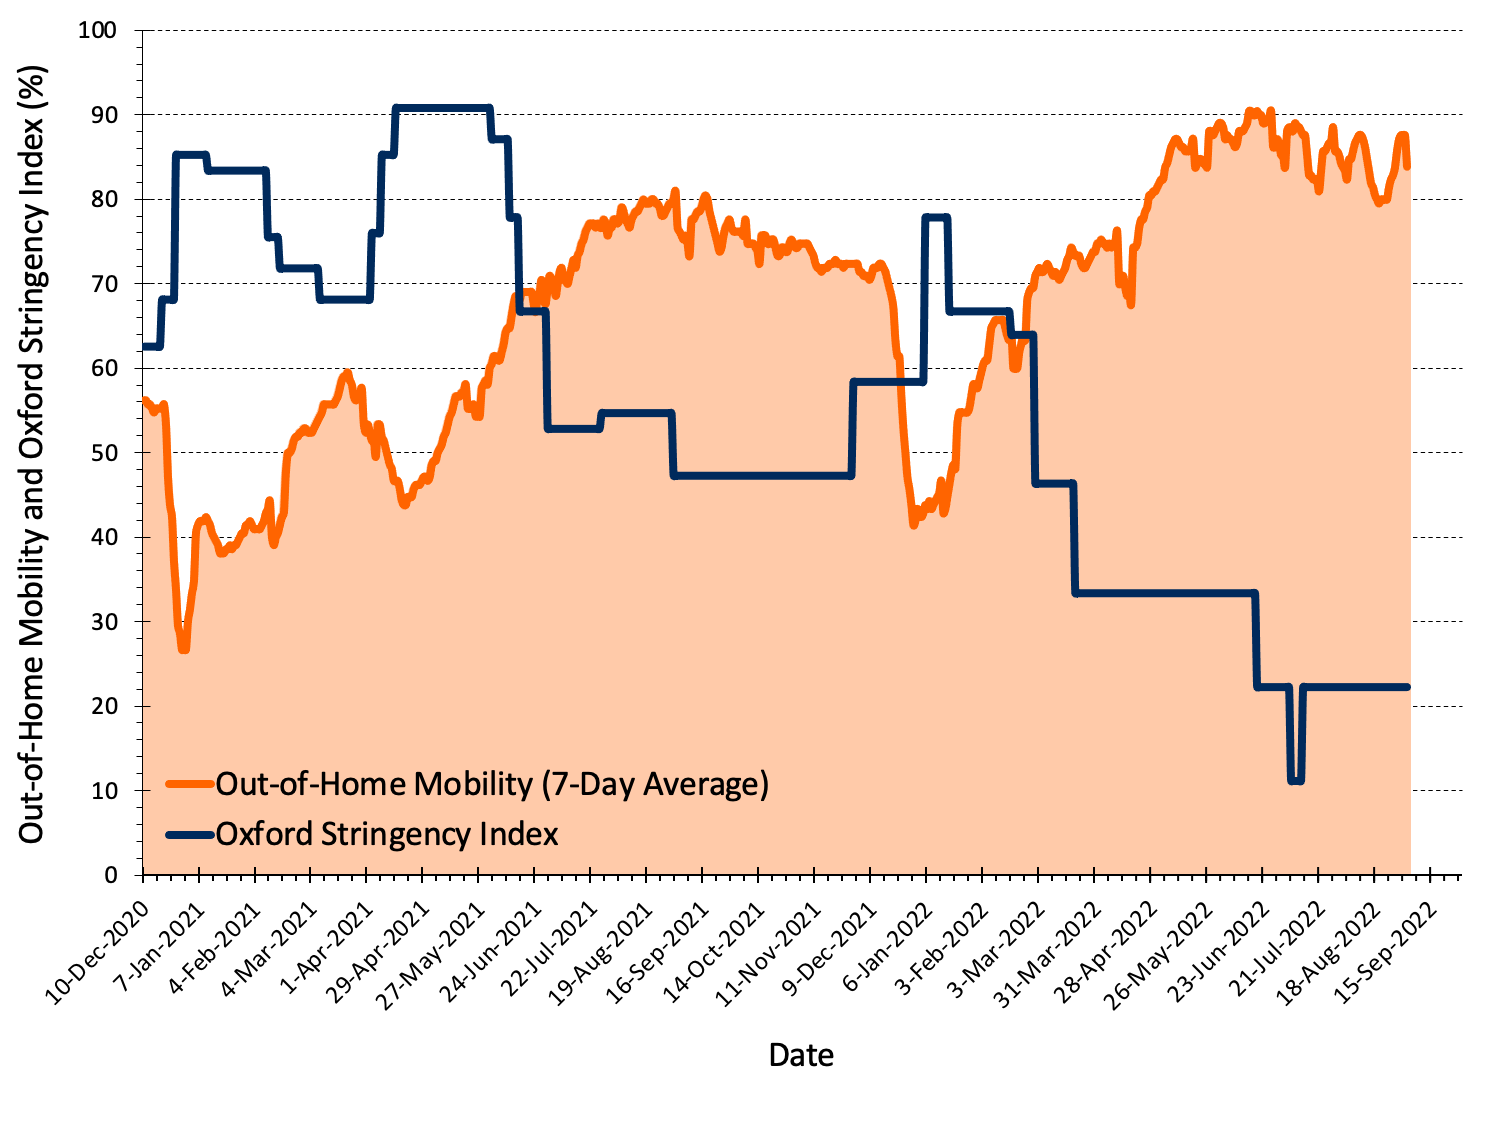
Oxford Stringency Index and Out-of-Home Mobility in Ontario
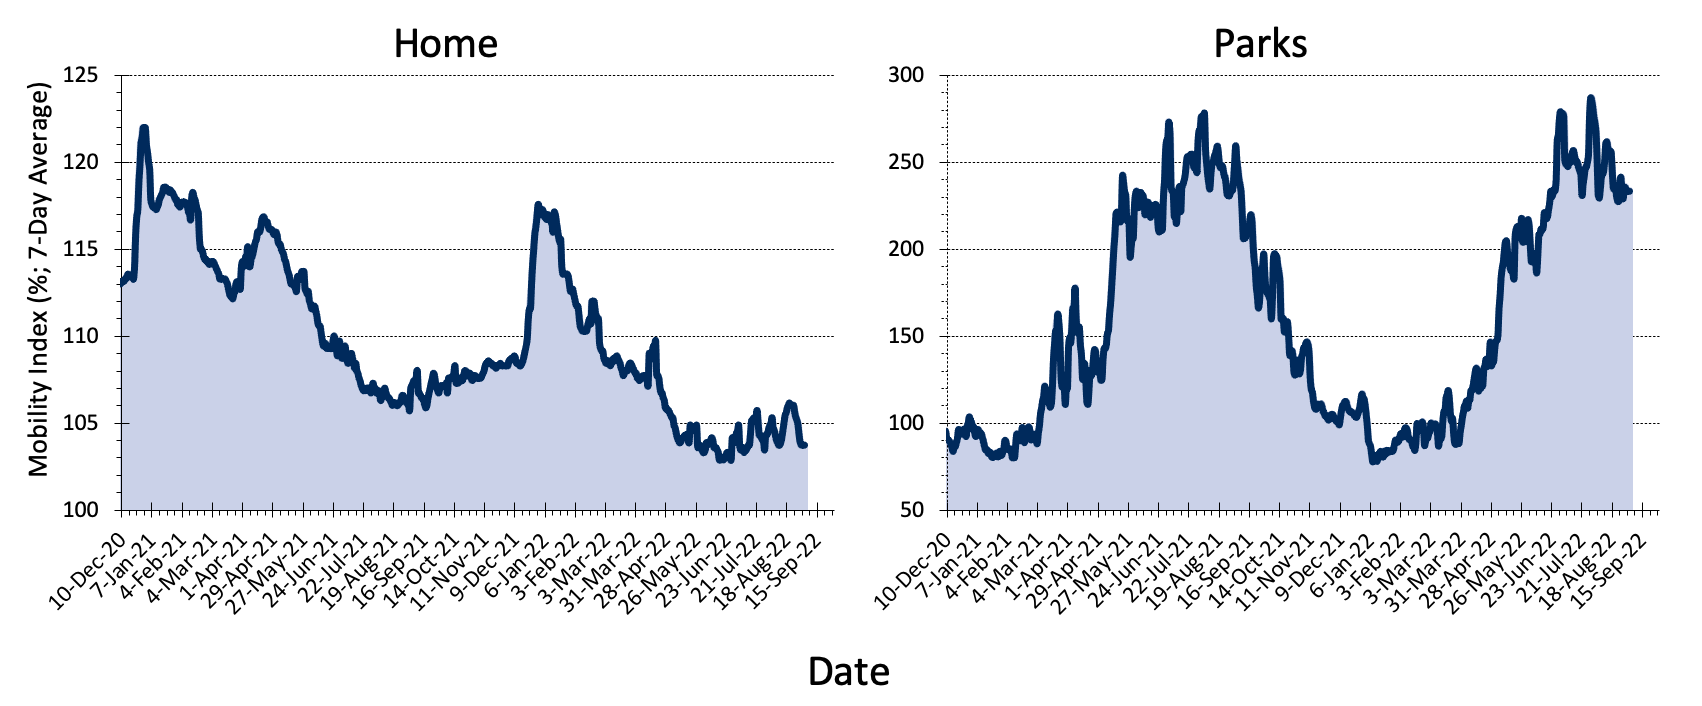
Mobility Indicators of Low-Risk Activities in Ontario
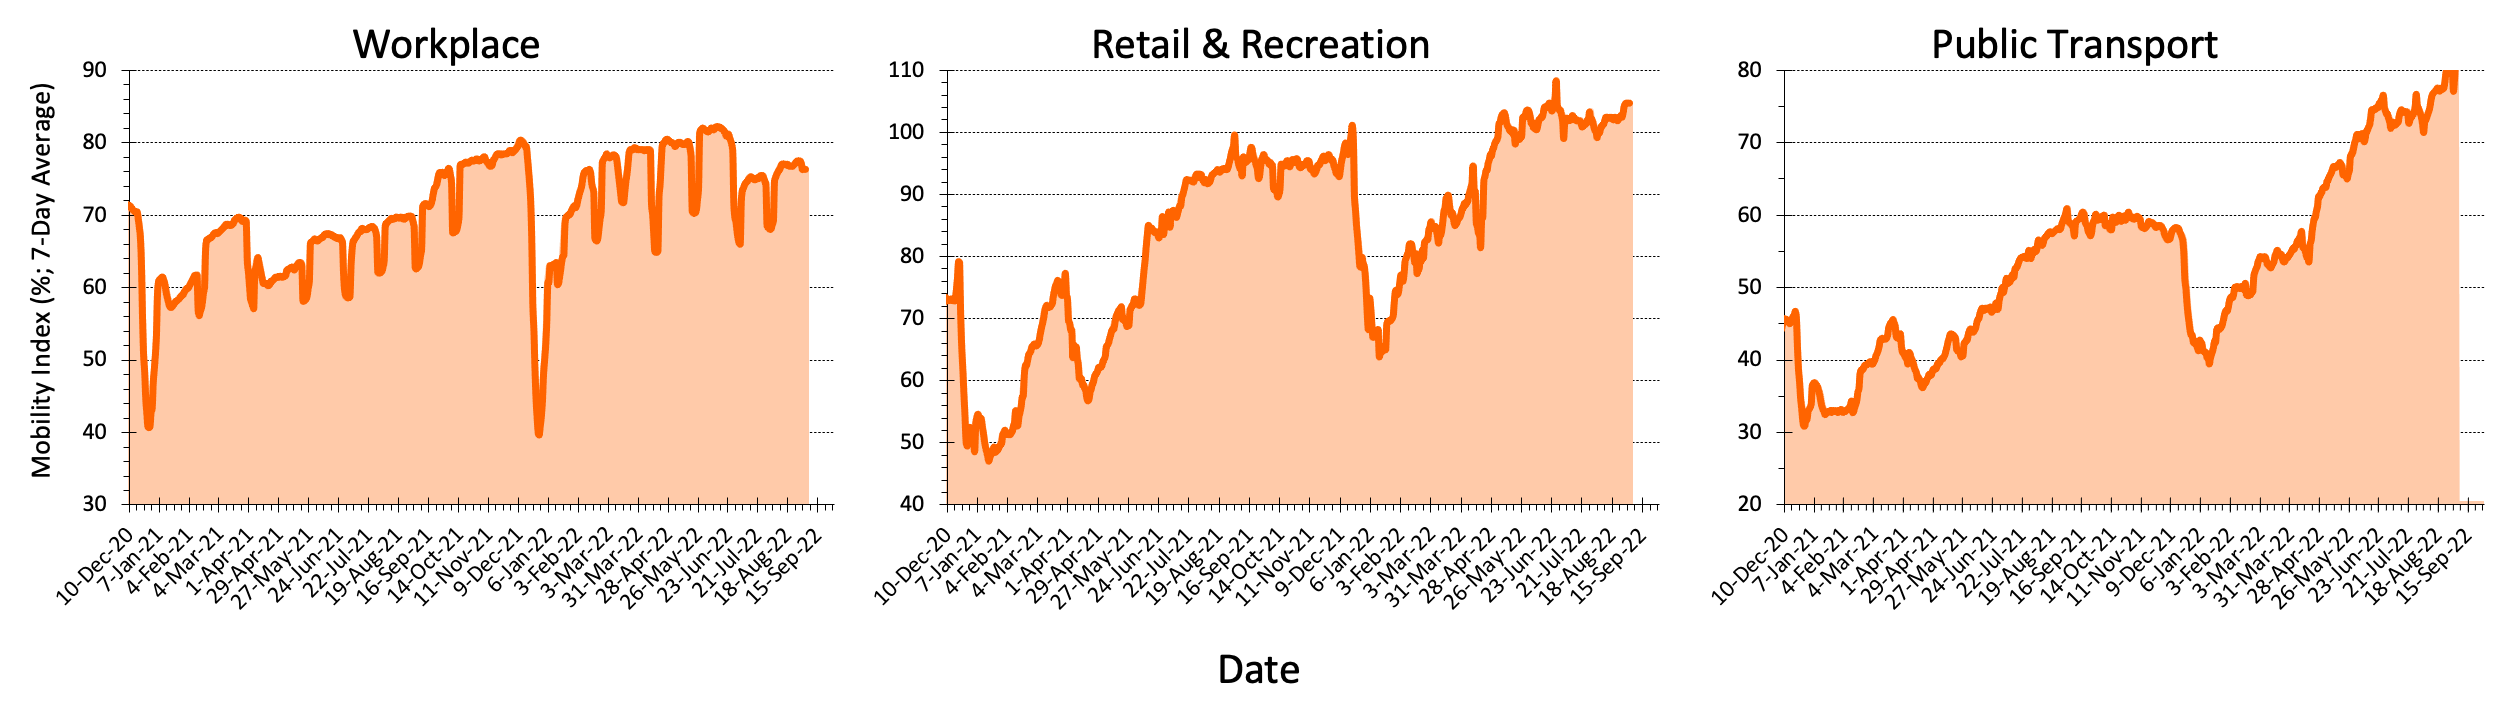
Mobility Indicators of High-Risk Activities in Ontario
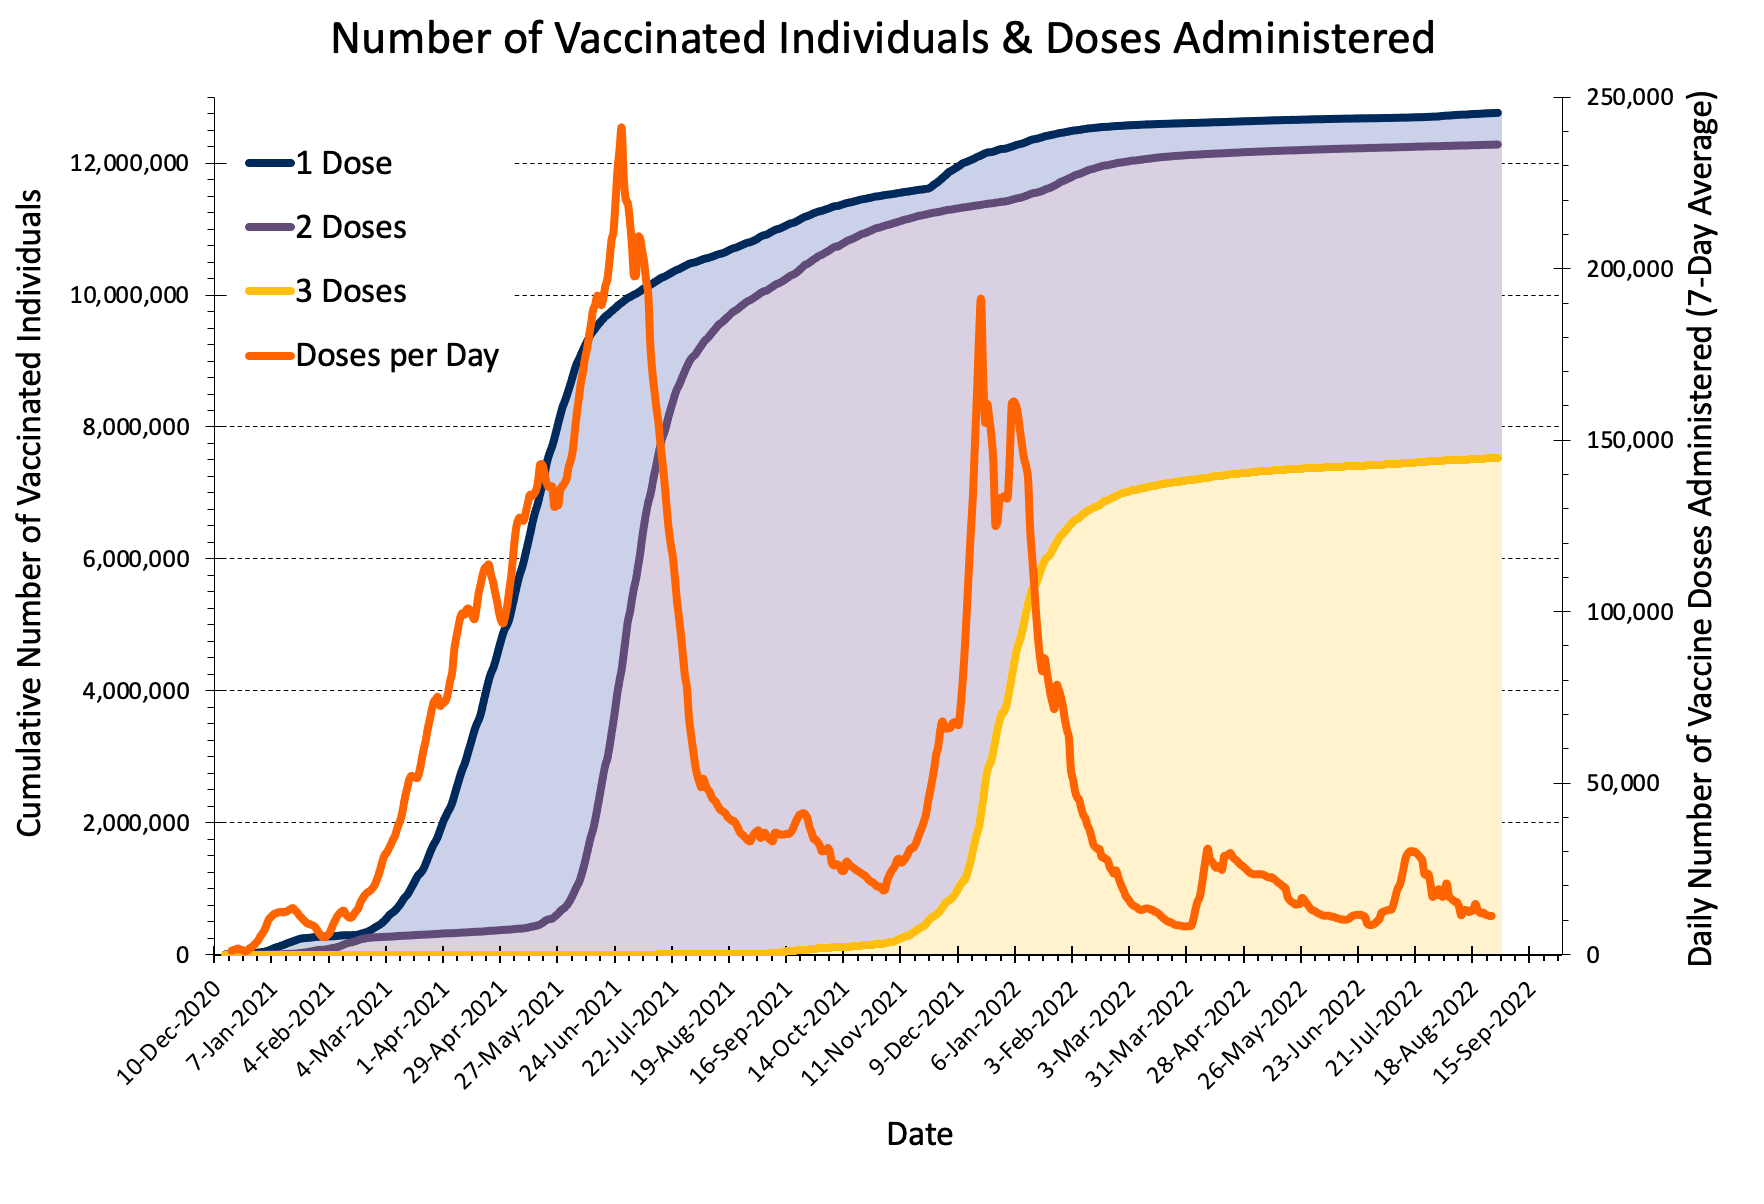
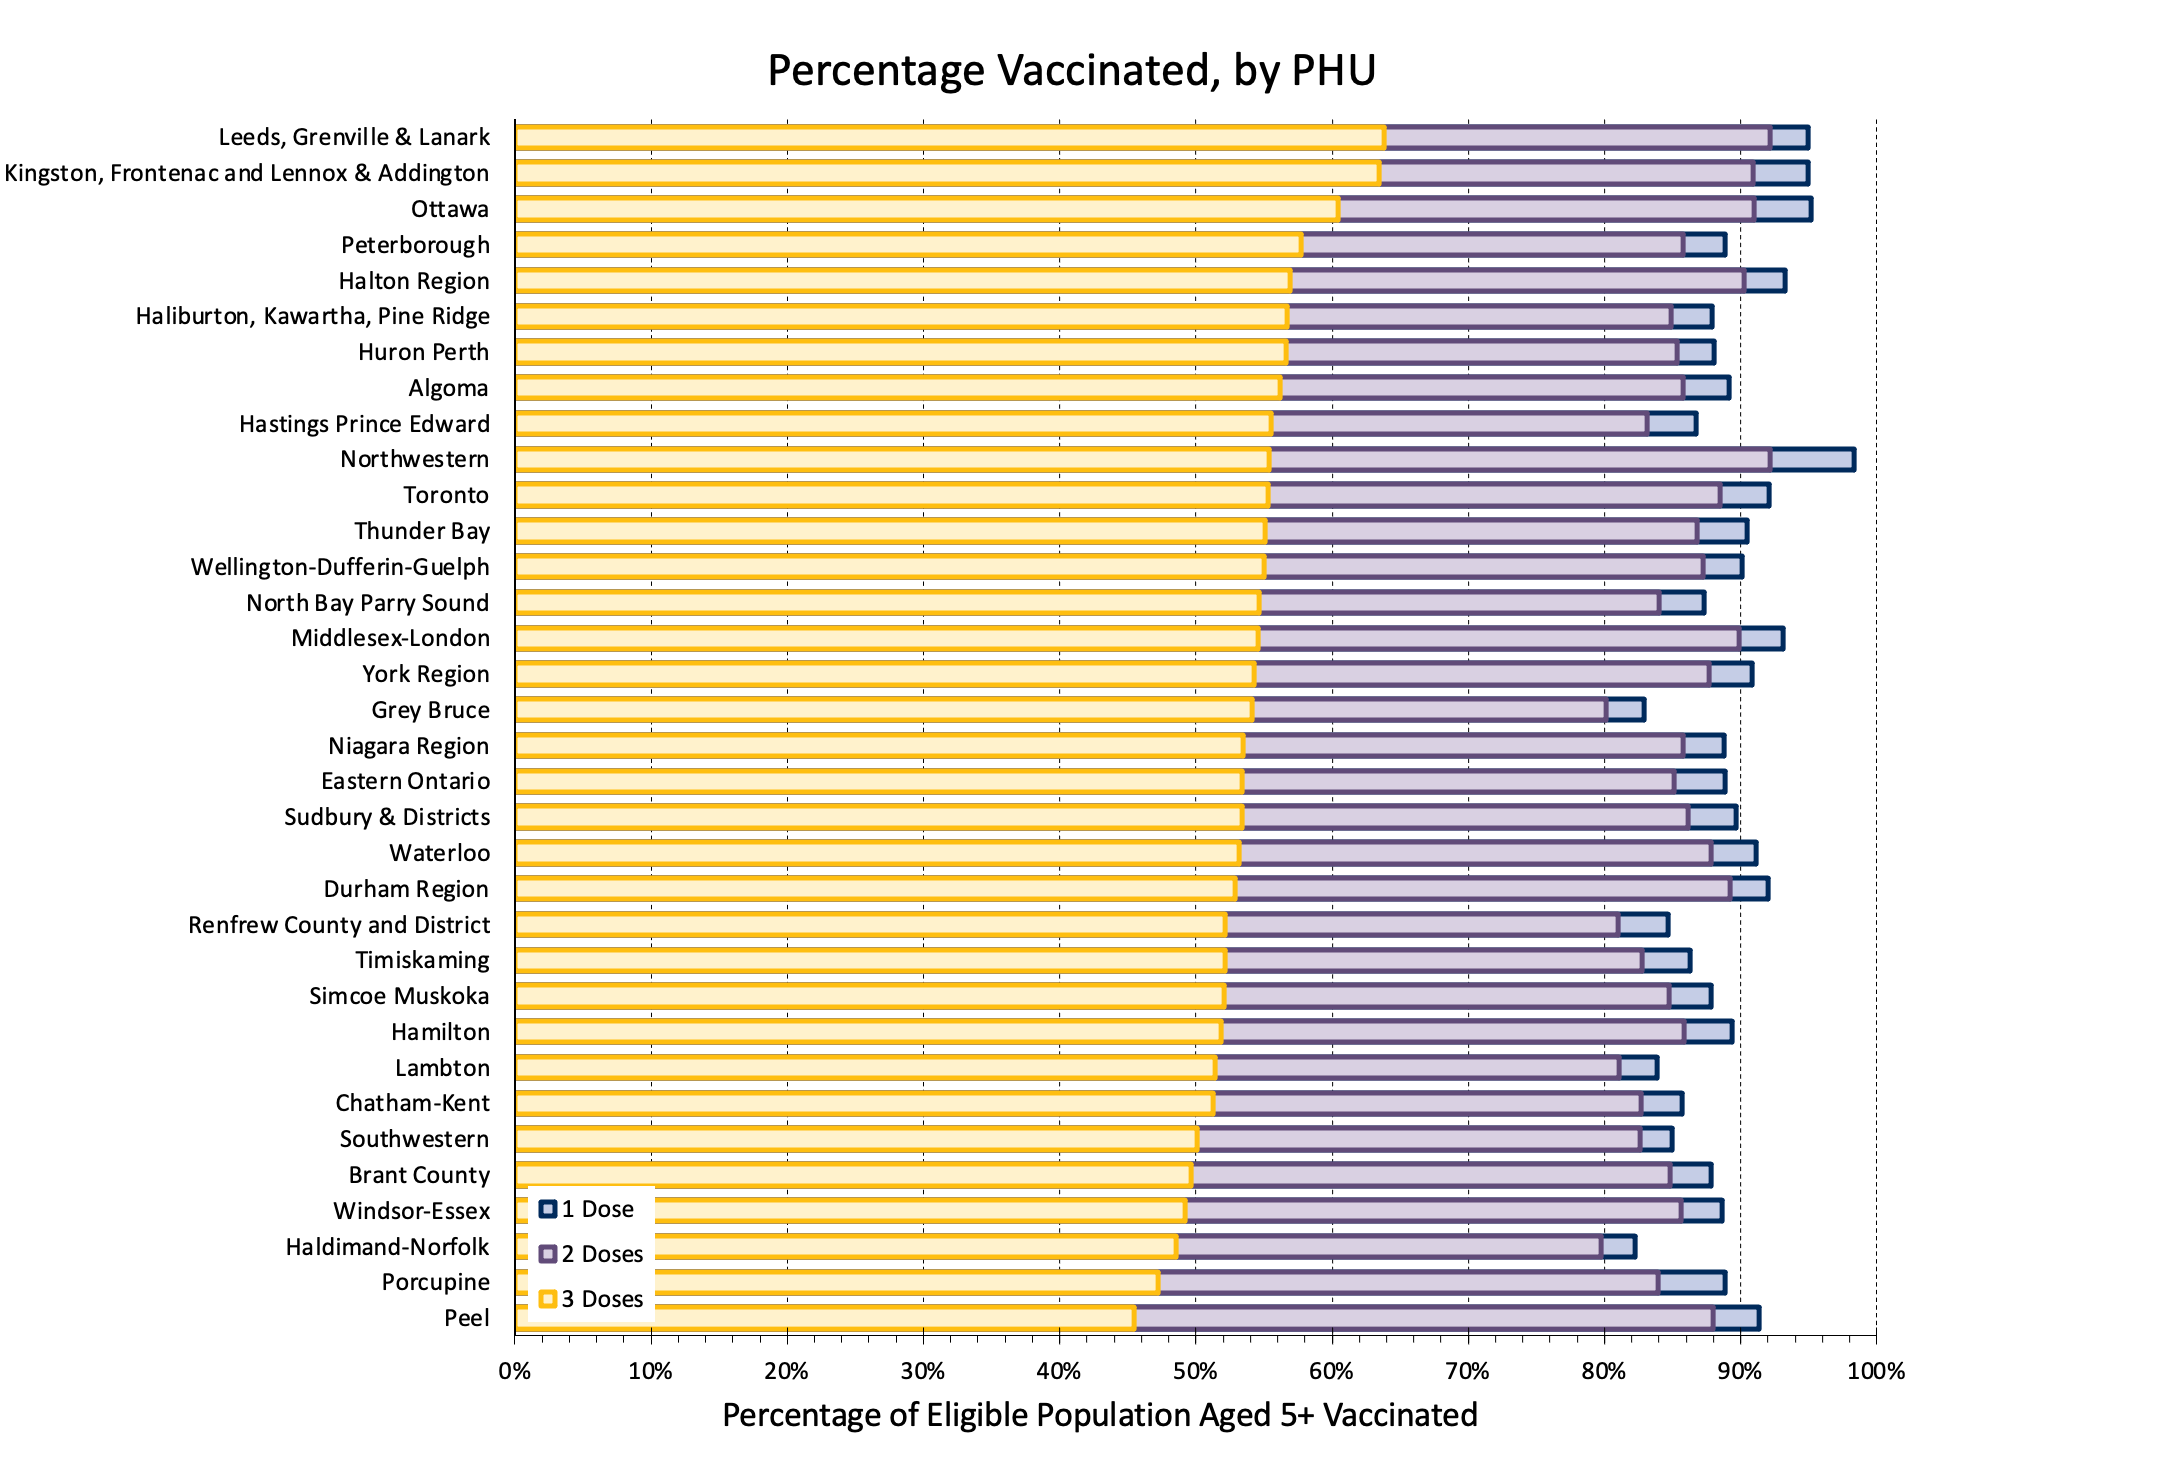
COVID-19 Vaccination in Ontario
Current COVID-19 Risk in Ontario by Vaccination Status
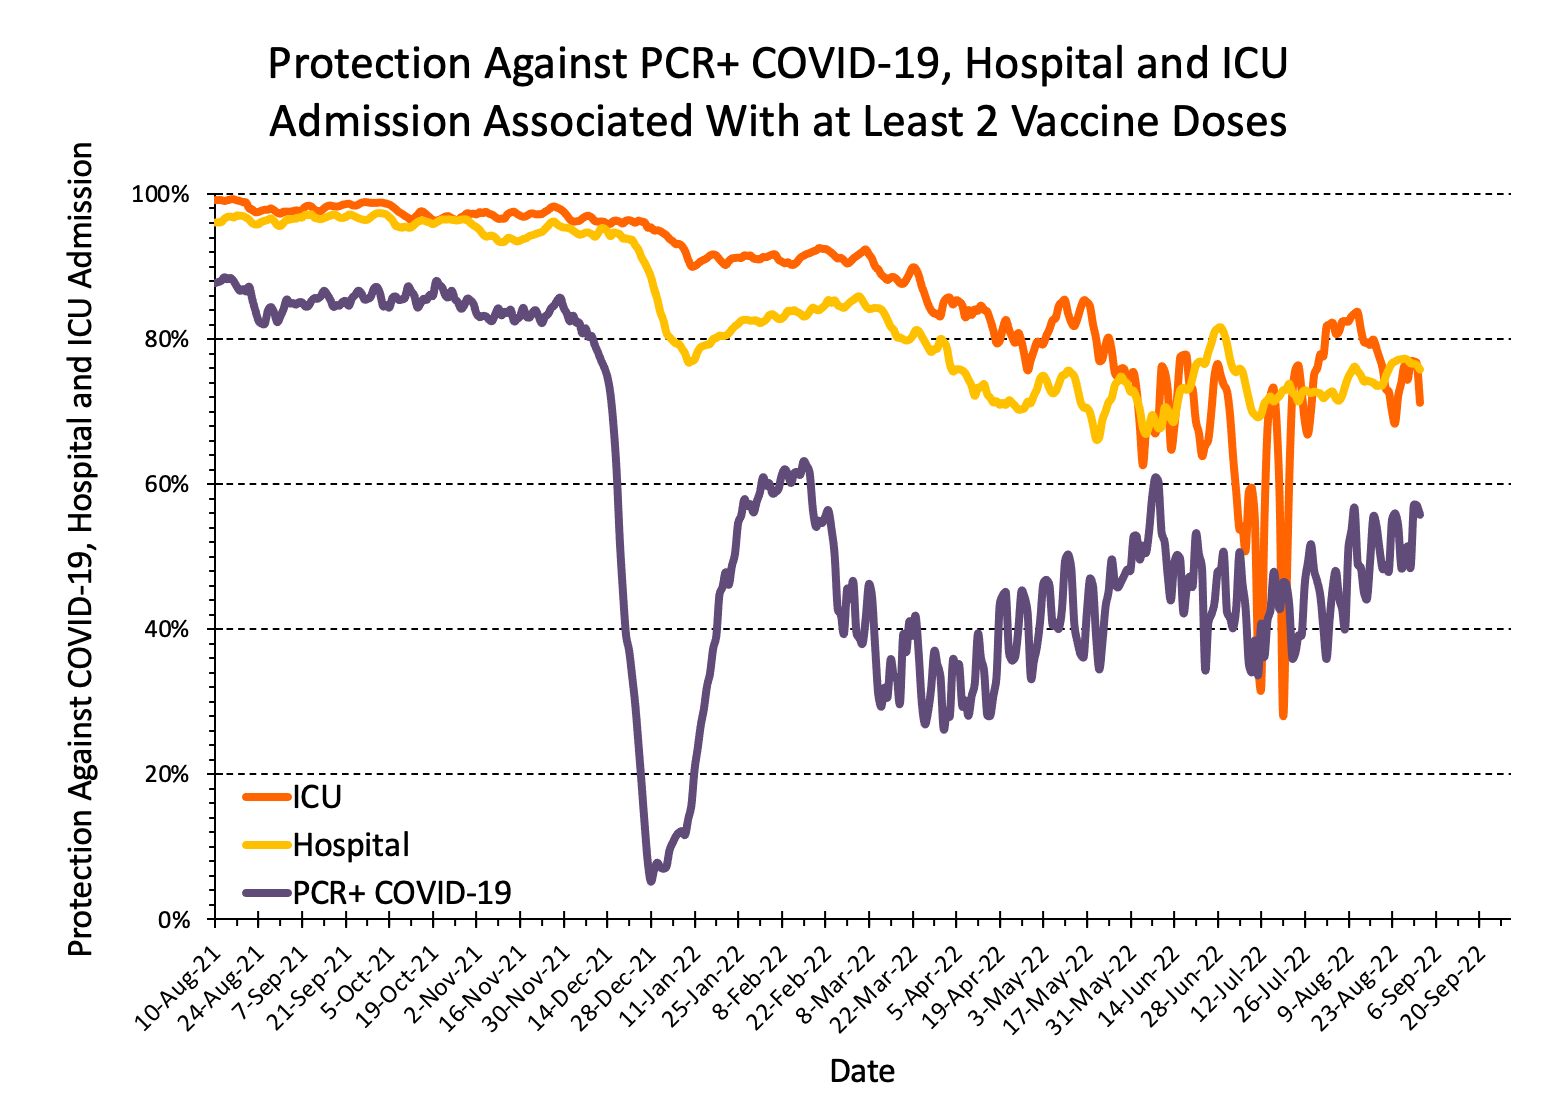
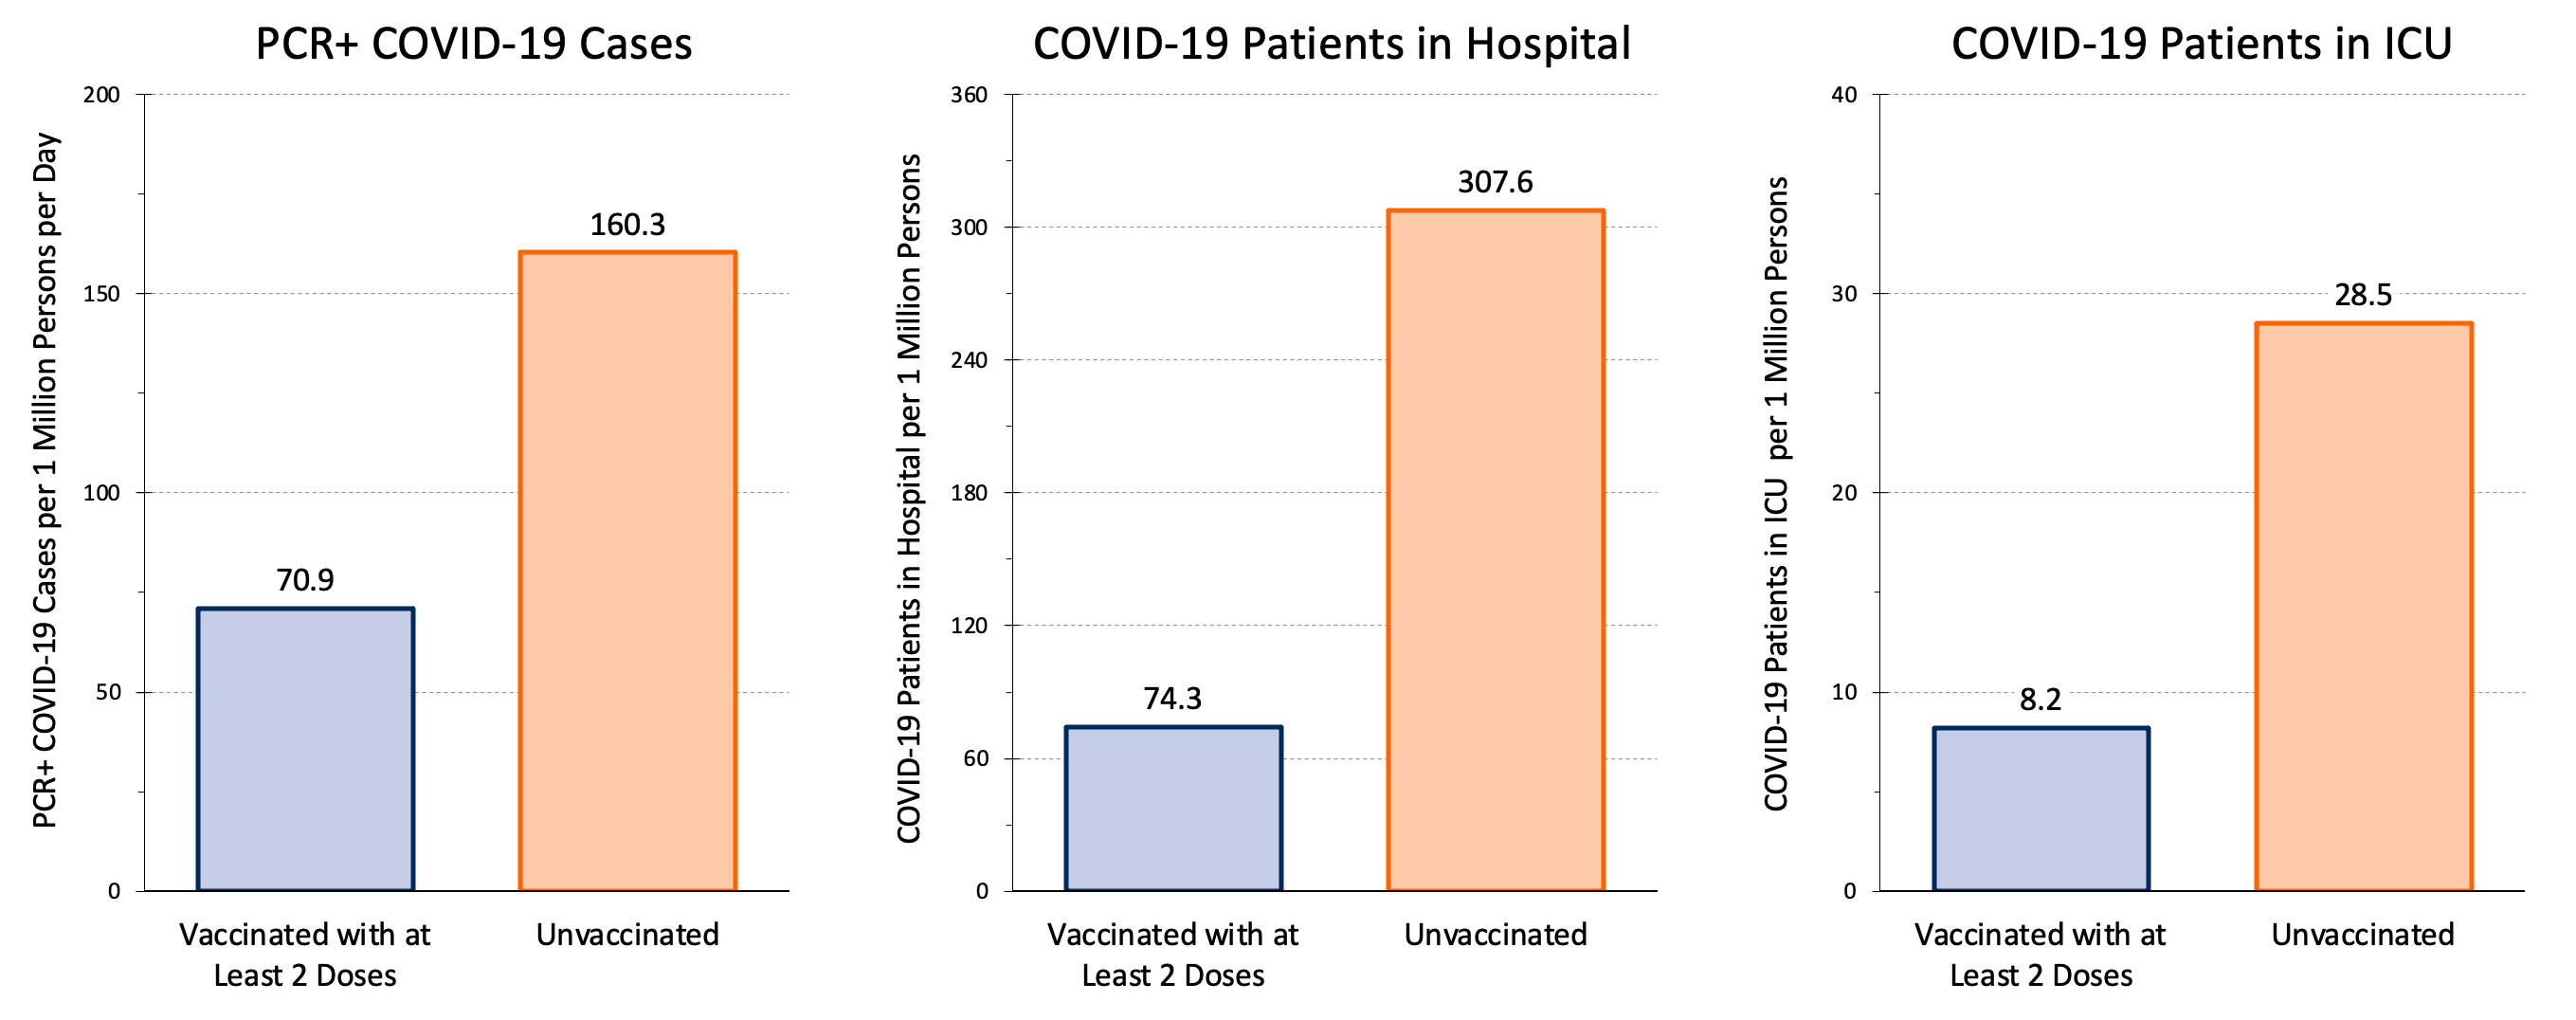
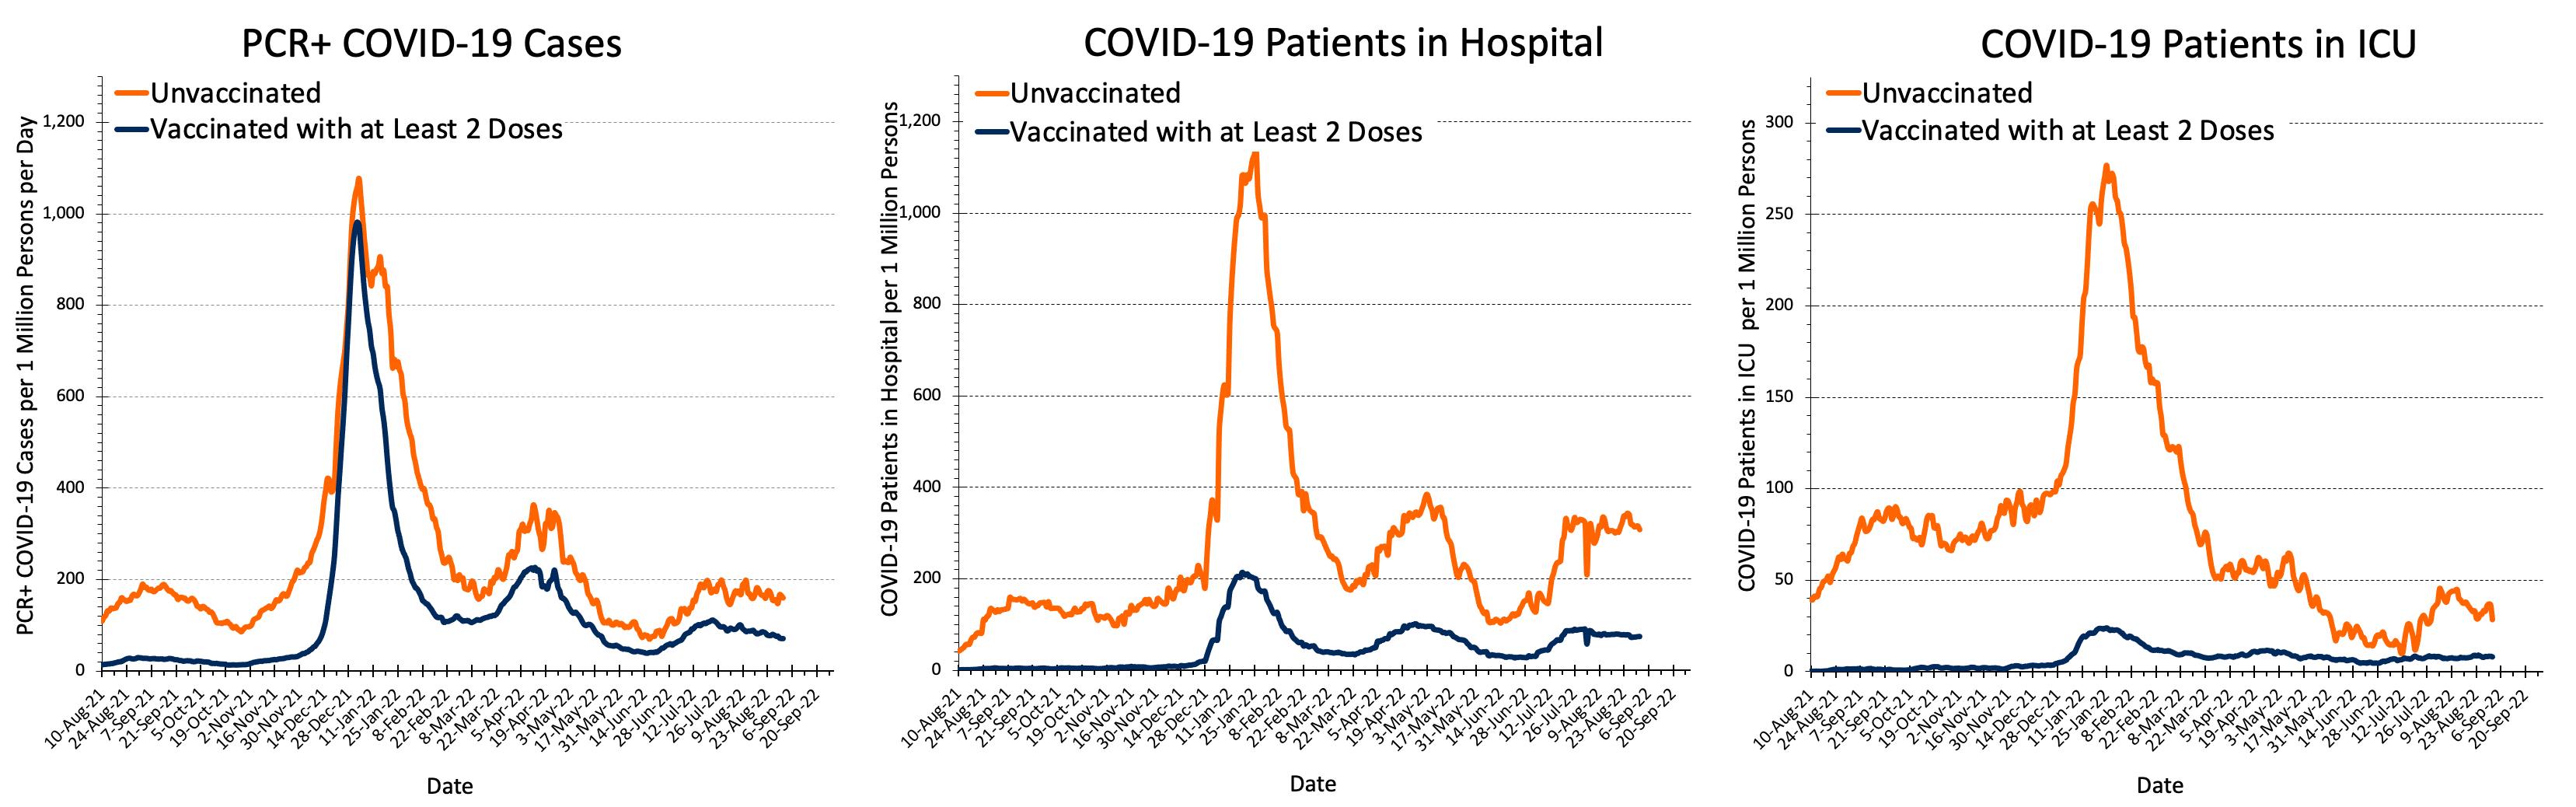
Estimates are age-standardized using Ontario’s current population and a single age cut-off to take into account differences in vaccine uptake and the risk of severe disease between children, adolescents and young adults (0-29 years) and remaining adults (30+ years). The currently available data do not allow for a more granular age standardization.Estimates are based on (1) 7-day averages of the proportions of fully vaccinated and unvaccinated patients hospitalized on wards and ICUs reported in Ontario’s daily surveys, and of fully vaccinated and unvaccinated cases; (2) on COVID-19 hospital and ICU occupancy and the 7-day average of COVID-19 cases in Ontario; and (3) on Ontario’s age-specific vaccination data 7 days before. Hospital occupancy includes patients in ICU. The estimated protection is 1 minus the age-standardized rate ratio comparing people who have received at least 2 doses of a COVID-19 vaccine with people who have not yet received a COVID-19 vaccine, and is expressed as a percentage. All estimates are updated daily. The apparent trend towards a decrease in protection against hospital and ICU admission associated with at least 2 vaccine doses from March 2022 onwards is at least partially explained by increasing immunity of unvaccinated people with a history of recent infection.
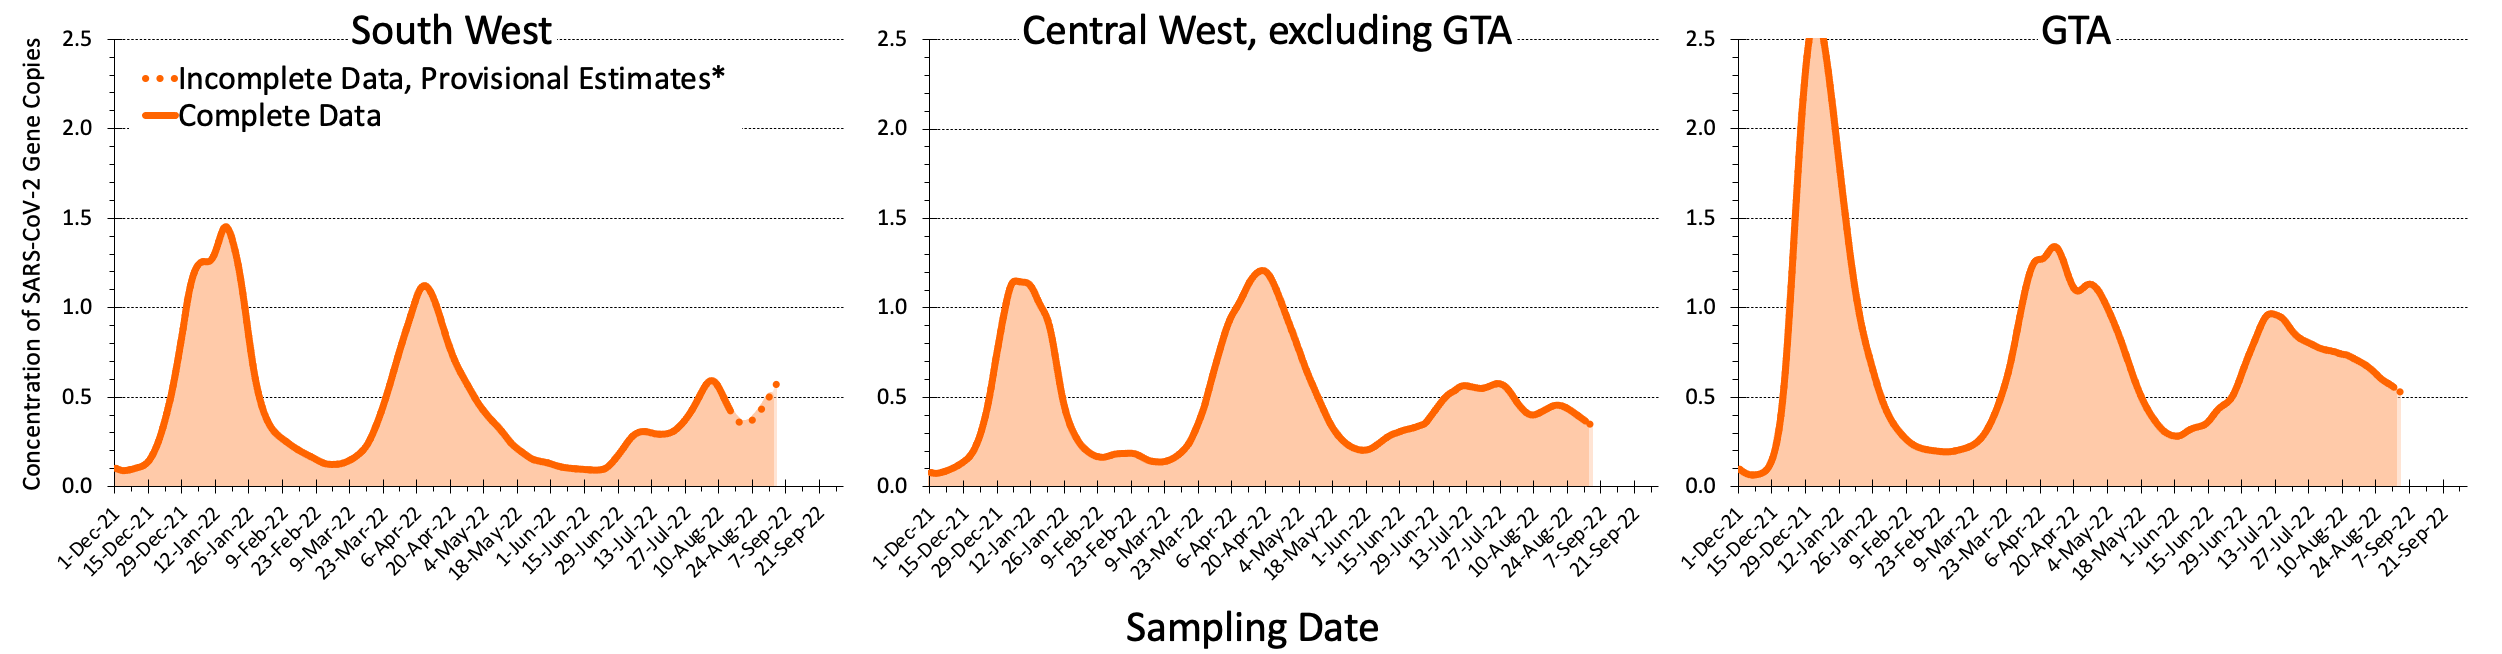
COVID-19 Wastewater Signals in Ontario
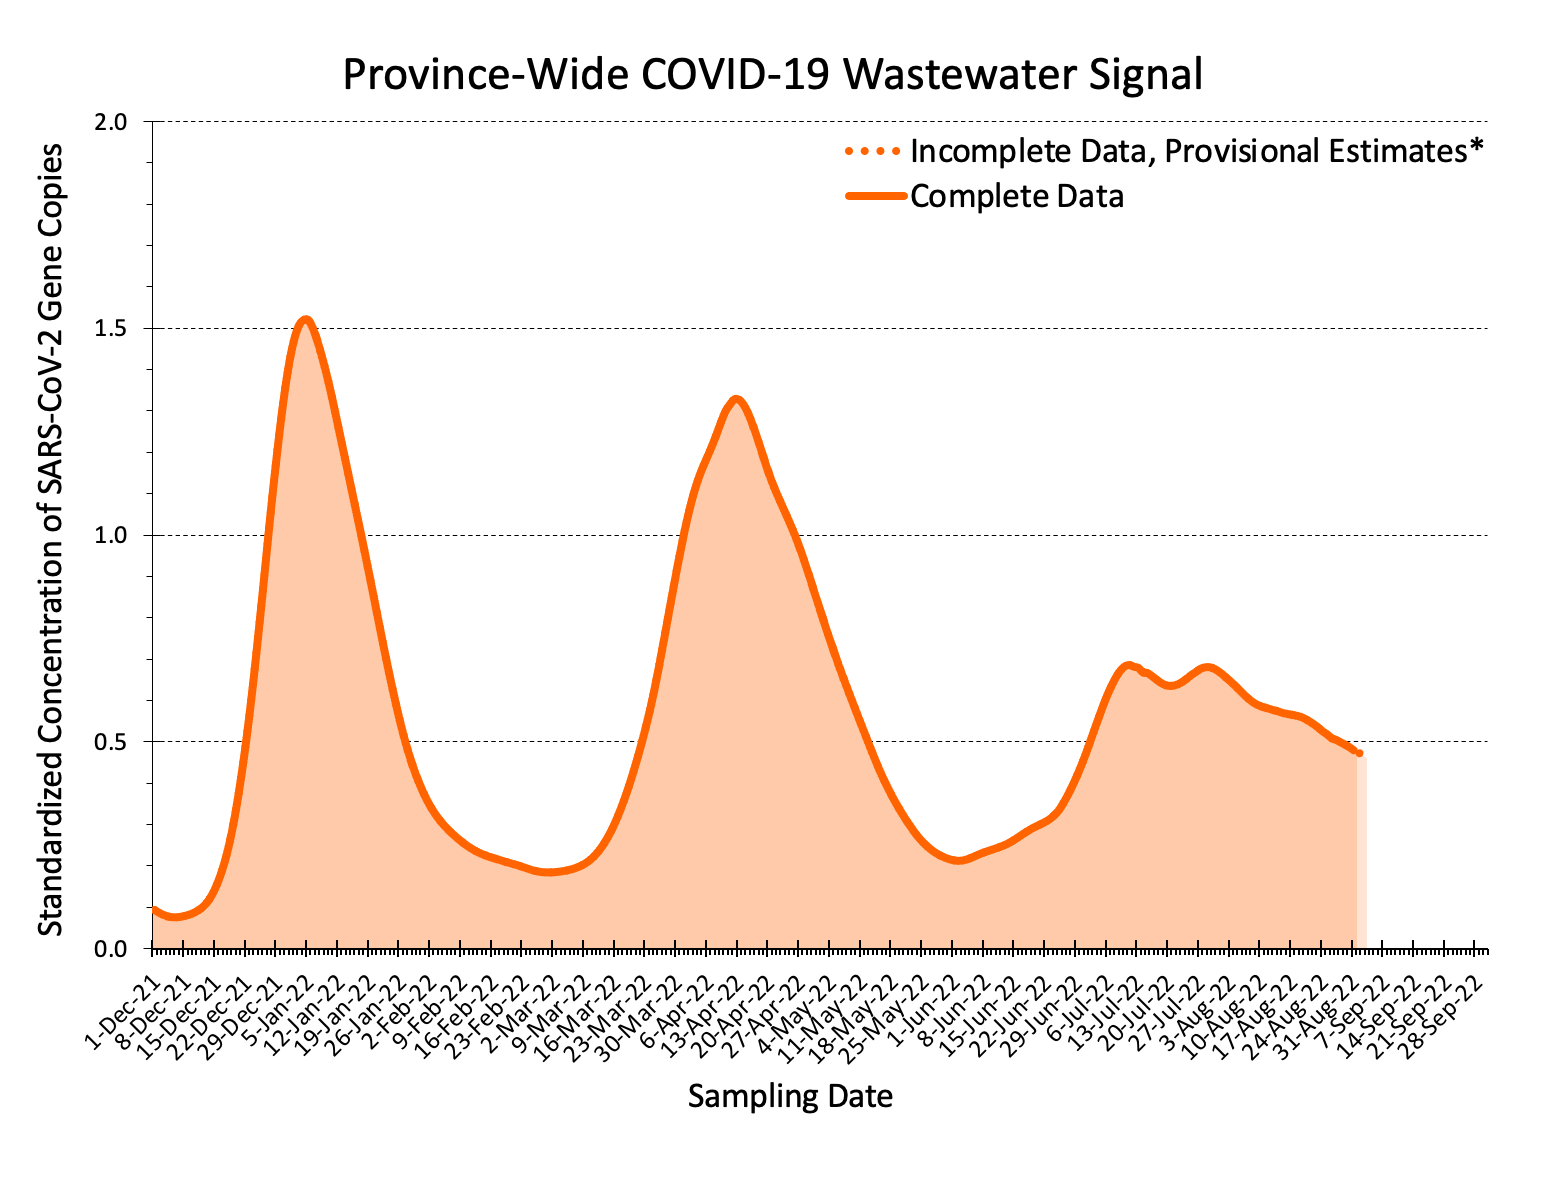
Fixed-effects meta-analyses were used to calculate daily inverse-variance weighted means of log transformed estimates within each public health unit. Daily inverse-variance weighted means were then combined in a fixed-effects analysis across public health units using population size of public health units as analytical weight. Resulting daily weighted means were exponentiated and therefore represent standard deviation units.
*The dotted orange line and the lighter shaded area represent incomplete data (less than 90% of data available on a given date). The dashed red line thus represents the currently available best estimates using the statistical approaches above to account for not yet available data, but are provisional. As such they may be under- or over-estimates and may change when more data become available.
To account for the proportion of the wastewater that is from humans and the proportion that is rain water, snow melt, etc., N1 and N2 gene concentrations are normalized using the seasonally stable fecal biomarker pepper mild mottle virus (PMMoV). Samples are typically taken 3 times per week at each location. There is a 5 to 7 day lag between the detection of SARS-CoV-2 gene copies in the wastewater, and the diagnosis and reporting of COVID-19 cases. The wastewater signal on January 21, for example, is reflected in reported COVID-19 cases around January 26 to 28.

*The dotted orange line and the lighter shaded area represent incomplete data (less than 90% of data available on a given date). The dashed red line thus represents the currently available best estimates using the statistical approaches above to account for not yet available data, but are provisional. As such they may be under- or over-estimates and may change when more data become available.
Ontario’s wastewater surveillance is coordinated and hosted by the Ministry of the Environment, Conservation and Parks (MECP). Laboratory analyses are done by Carleton University, University of Guelph, Health Sciences North Research Institute, McMaster University, National Microbiology Laboratory, Ontario Tech University, University of Ottawa, Queen’s University, Ryerson University, University of Toronto, Trent University, University of Waterloo, University of Western Ontario and University of Windsor.
Estimated Rate of COVID-19 Cases per 1 Million Inhabitants per Day in Ontario
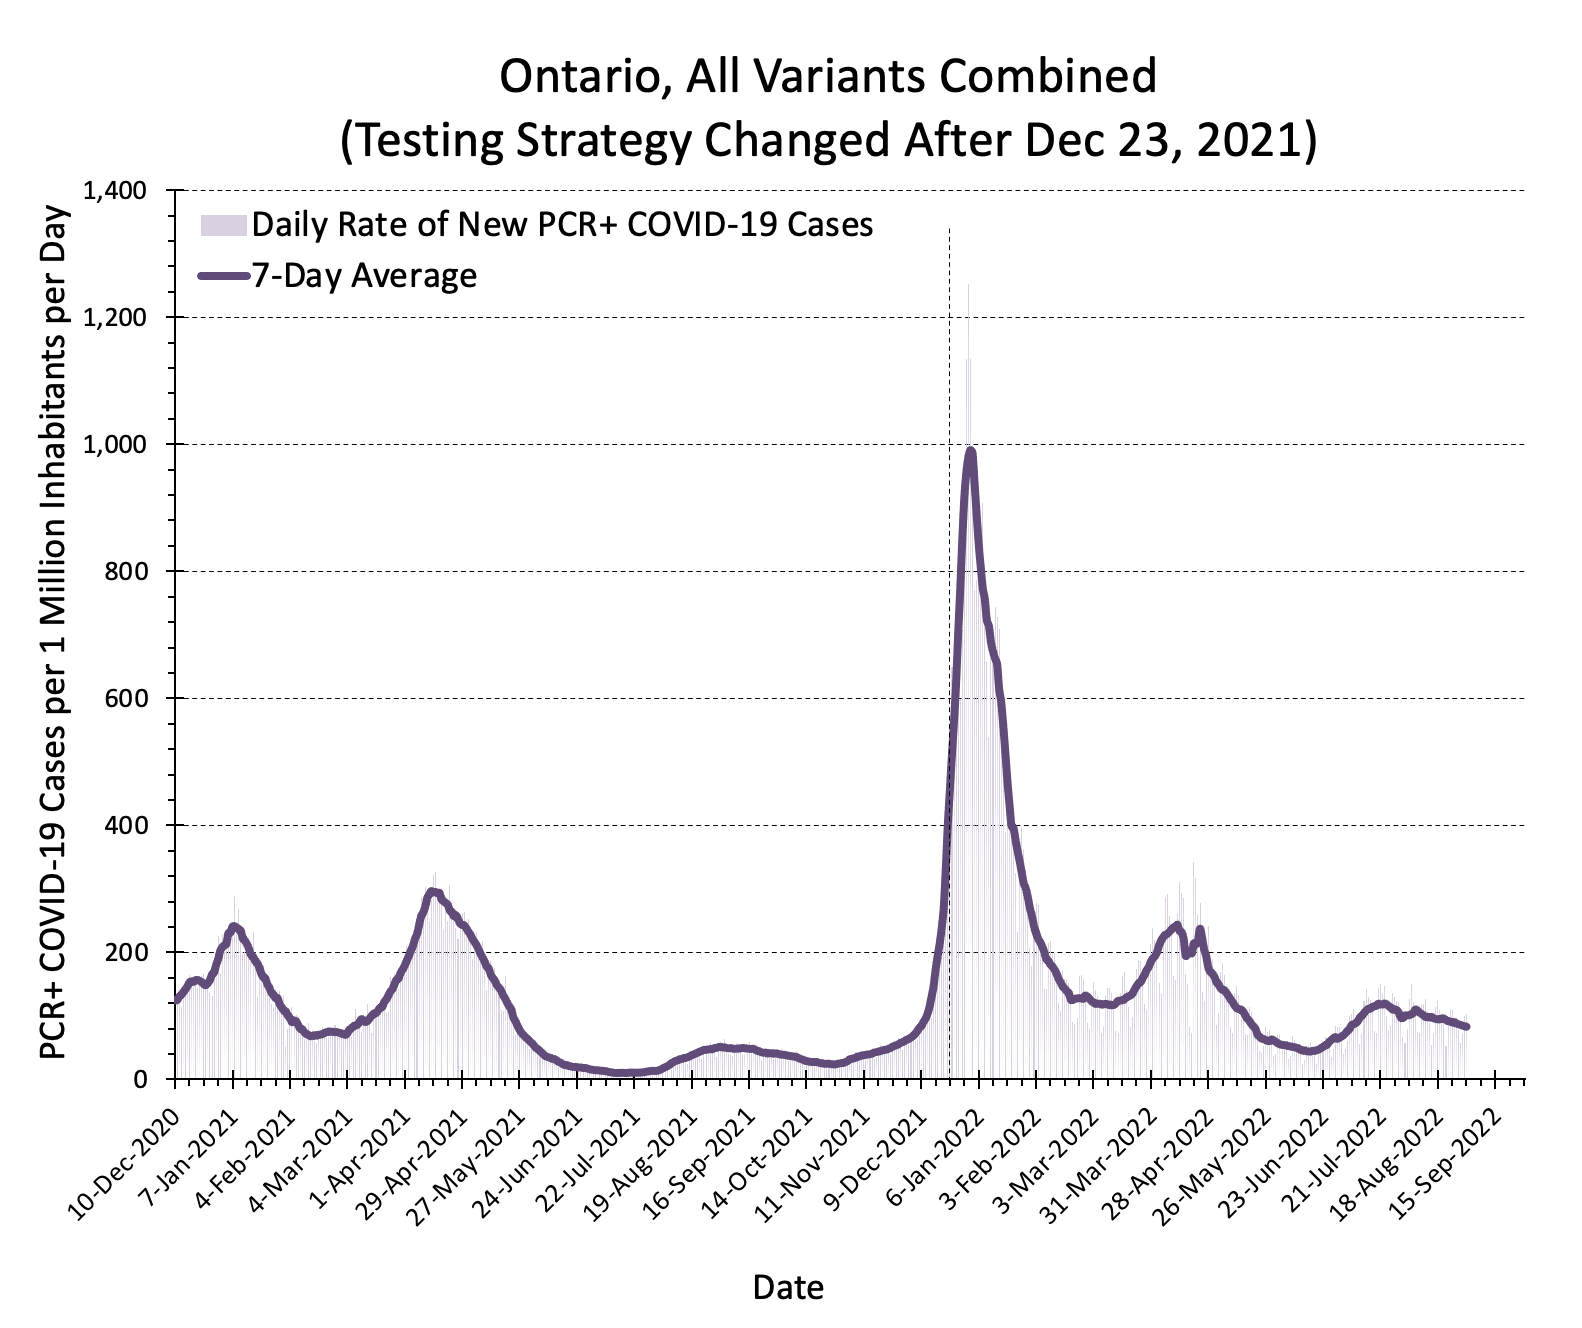

PHU specific rates are truncated at 200 PCR+ COVID-19 cases per million persons per day. Note that local testing strategies may influence rates: small PHUs with higher intensity of testing tend to have higher rates than larger PHUs with lower intensity of testing.
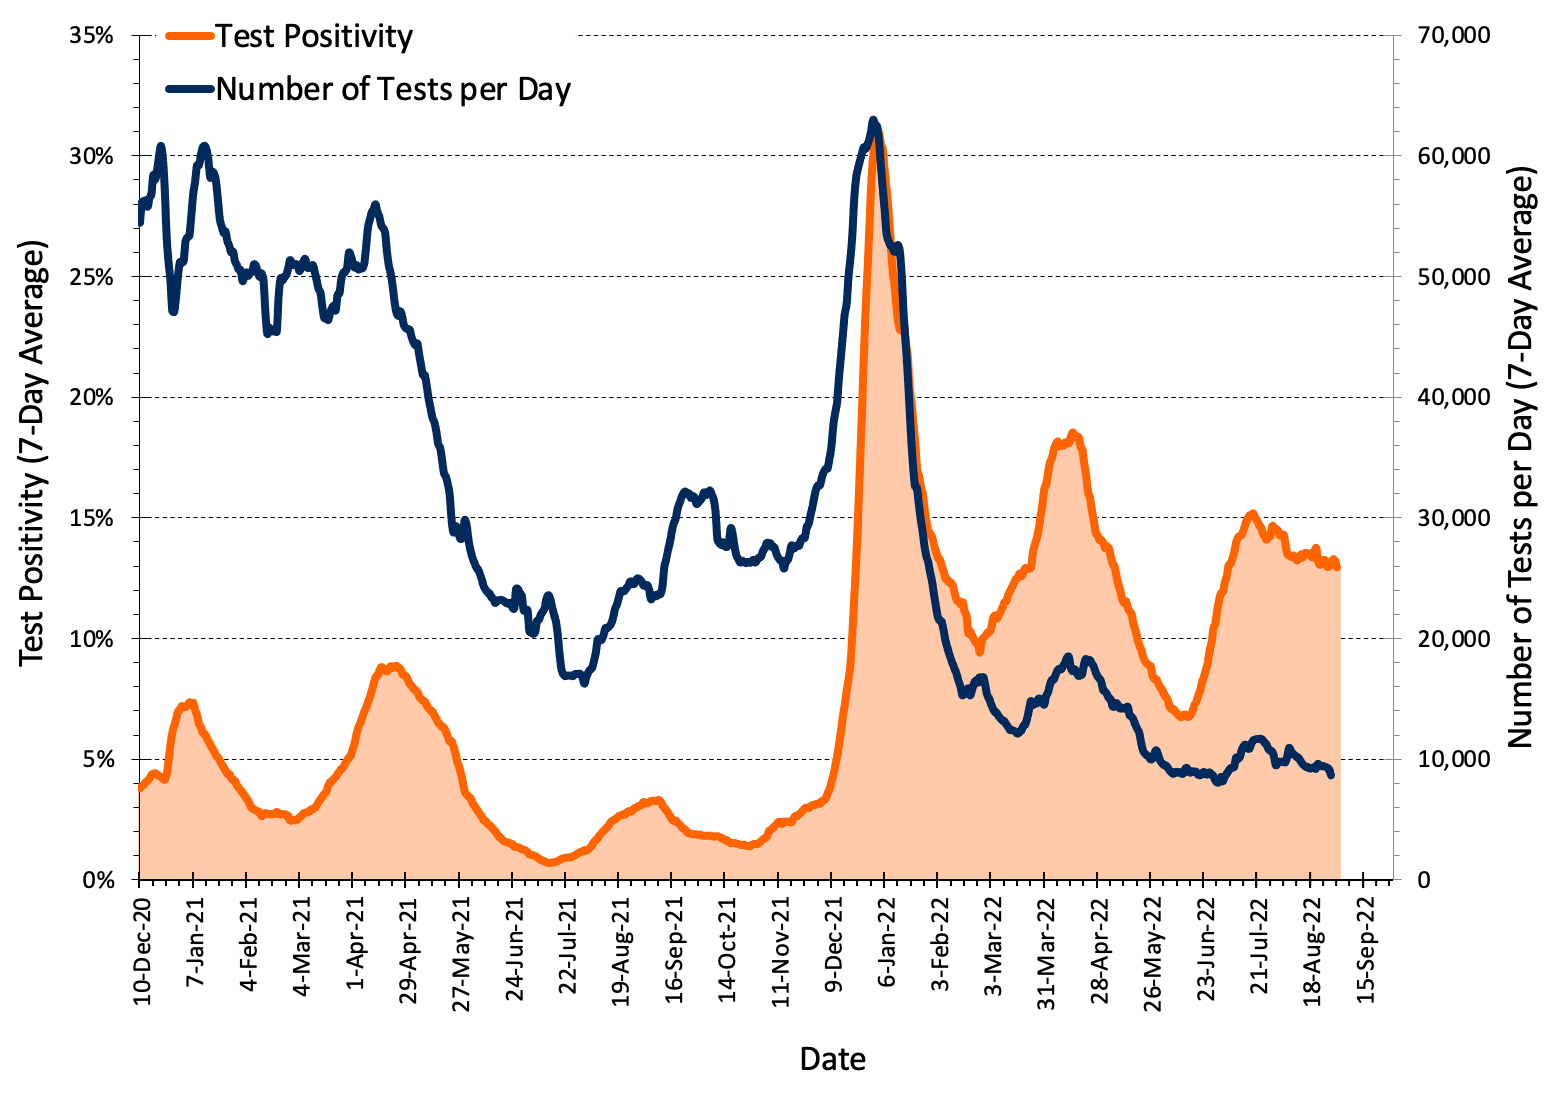
Test Positivity and Number of COVID-19 Tests in Ontario
Effective Reproduction Number R(t) in Ontario
Percentage of Cases Caused by Different Variants in Ontario
Number of Public Health Units With Exponential Growth in Ontario
Daily COVID-19 Hospital and ICU Occupancy in Ontario
Daily COVID-19 Deaths in Ontario
Oxford Stringency Index and Out-of-Home Mobility in Ontario
Mobility Indicators of Low-Risk Activities in Ontario
Mobility Indicators of High-Risk Activities in Ontario
COVID-19 Vaccination in Ontario

Data sourced from:
https://covid19.apple.com/mobility/
https://ourworldindata.org/explorers/coronavirus-data-explorer
Public Health Case and Contact Management Solution and other case management systems (CCM plus)
https://www.google.com/covid19/mobility/
Wastewater Dashboard hosted by Ontario’s Ministry of the Environment, Conservation and Parks (MECP)
Citation:
Jüni P, da Costa BR, Maltsev A, Katz GM, Perkhun A, Yan S, Bodmer NS. Ontario dashboard. Science Briefs of the Ontario COVID-19 Science Advisory Table. 2021. https://doi.org/10.47326/ocsat.dashboard.2021.1.0