This website will be decommissioned as of April 30, 2026.
Archived information will remain available through the following resources:
- Science Briefs: Institute for Pandemics – Ontario COVID-19 Science Advisory Table Science Briefs Archive
- Full Website Archive: University of Toronto Archive
We encourage you to bookmark these links for future reference. If you have any questions, please contact communications@oahpp.ca.
Ontario dashboard.
NOTICE
As of September 8, 2022, this Dashboard is no longer updated. For more information on where you can find equivalent COVID-19 data and information, read the COVID-19 Indicator Roadmap.
View Count: 3221799
Current Status in Ontario
Contents
Current COVID-19 Risk in Ontario by Vaccination Status
COVID-19 Wastewater Signals in Ontario
Estimated Rate of COVID-19 Cases per 1 Million Inhabitants per Day in Ontario
Test Positivity and Number of COVID-19 Tests in Ontario
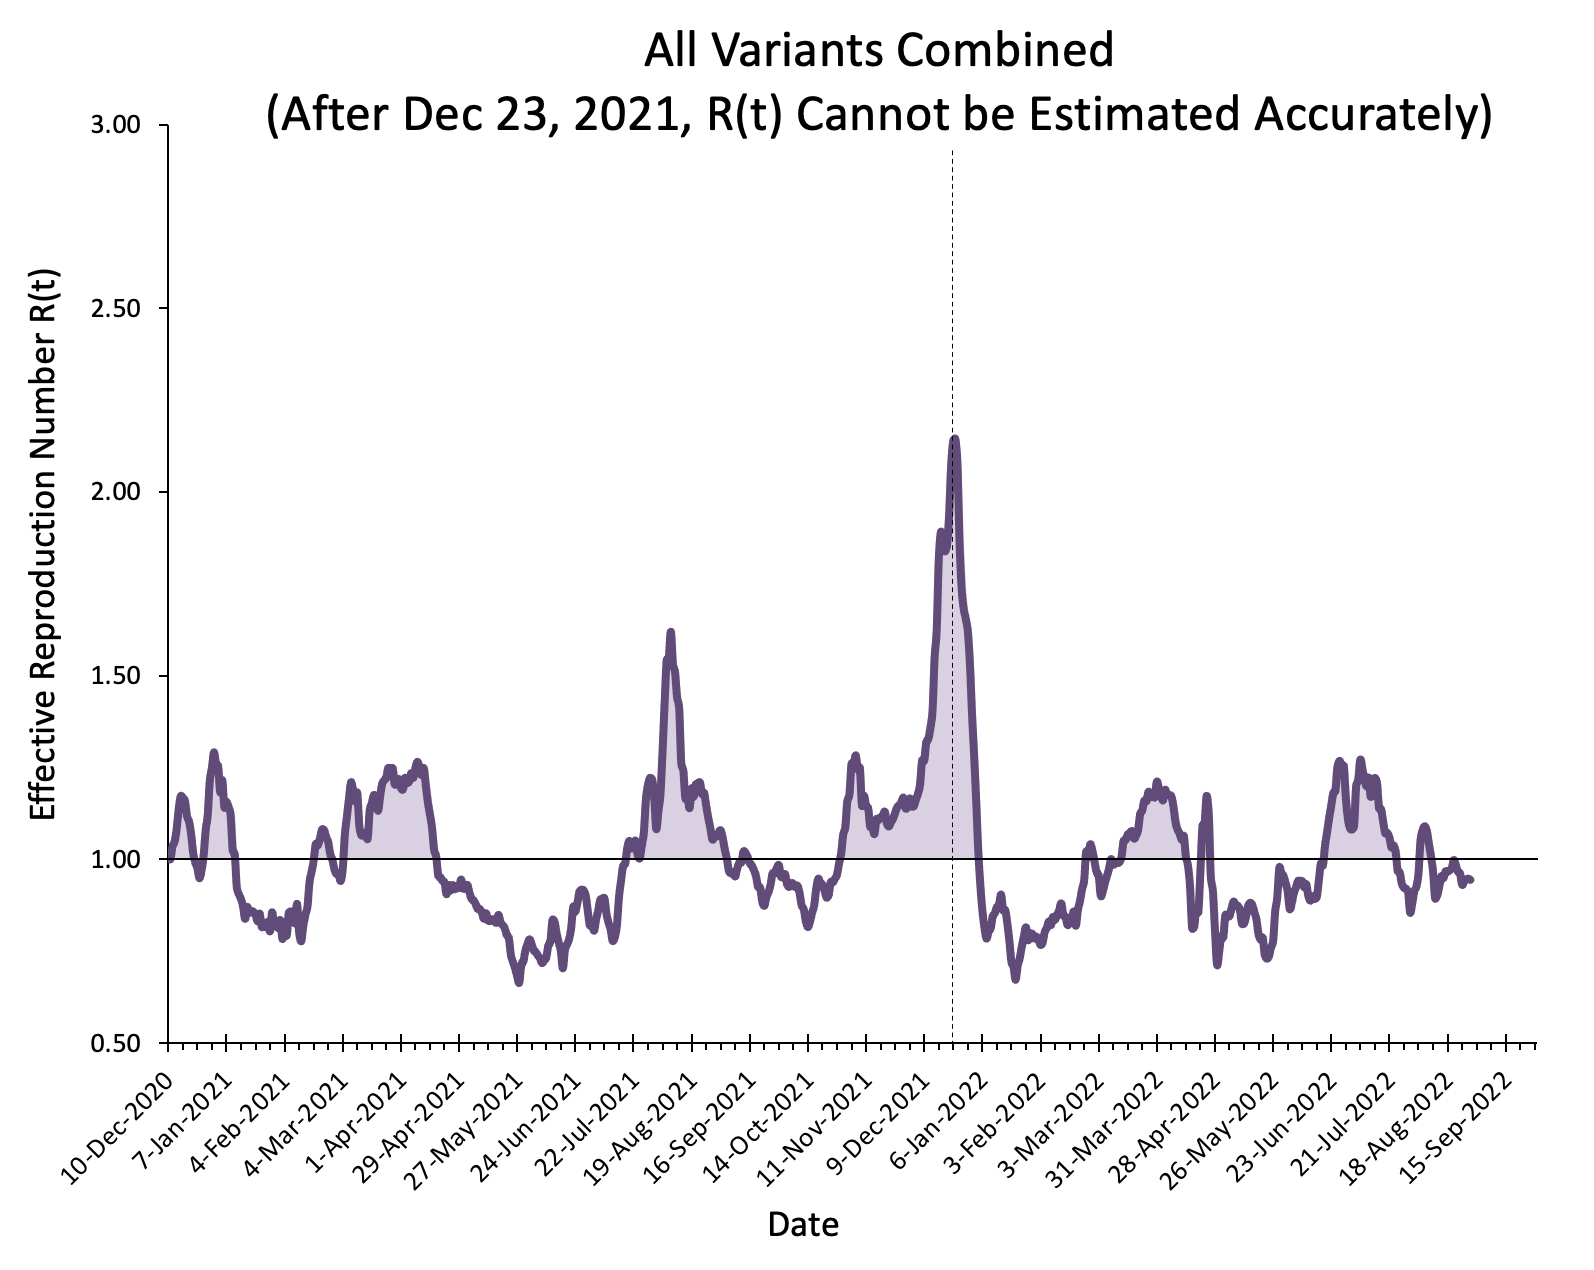
Effective Reproduction Number R(t) in Ontario
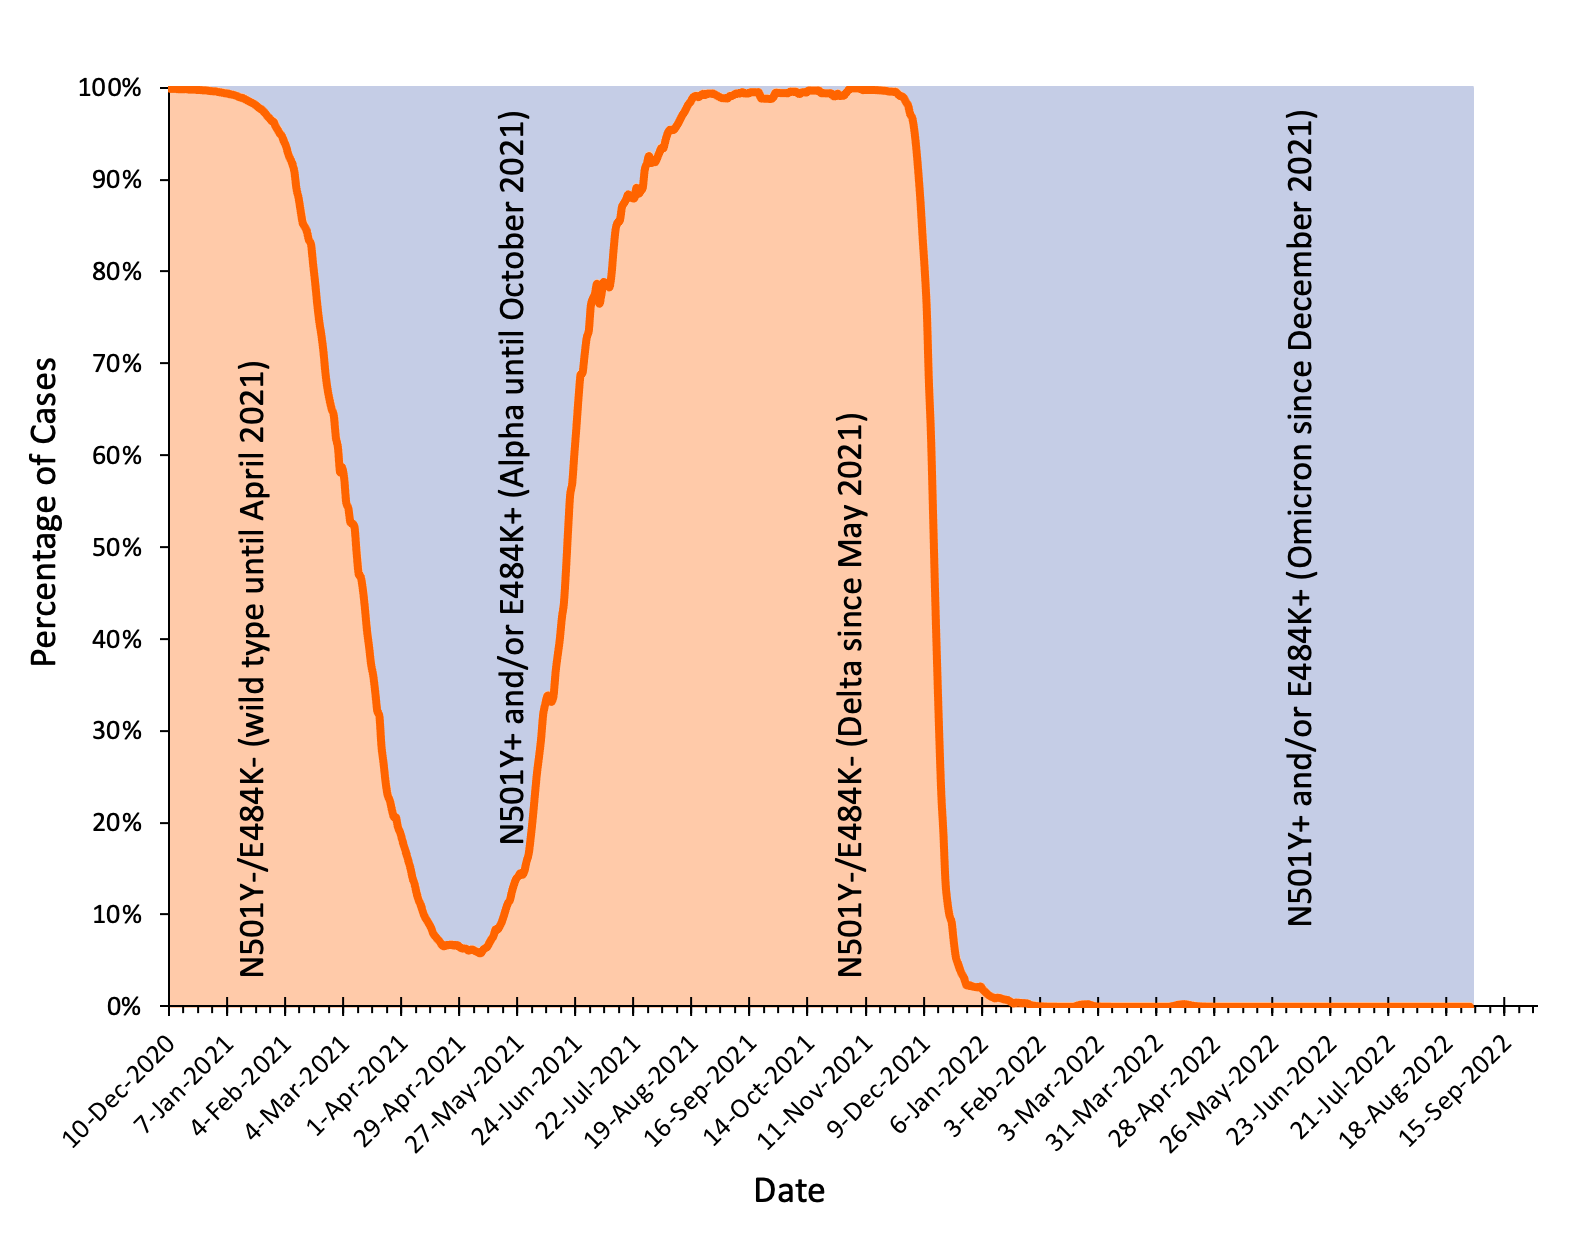
Percentage of Cases Caused by Different Variants in Ontario
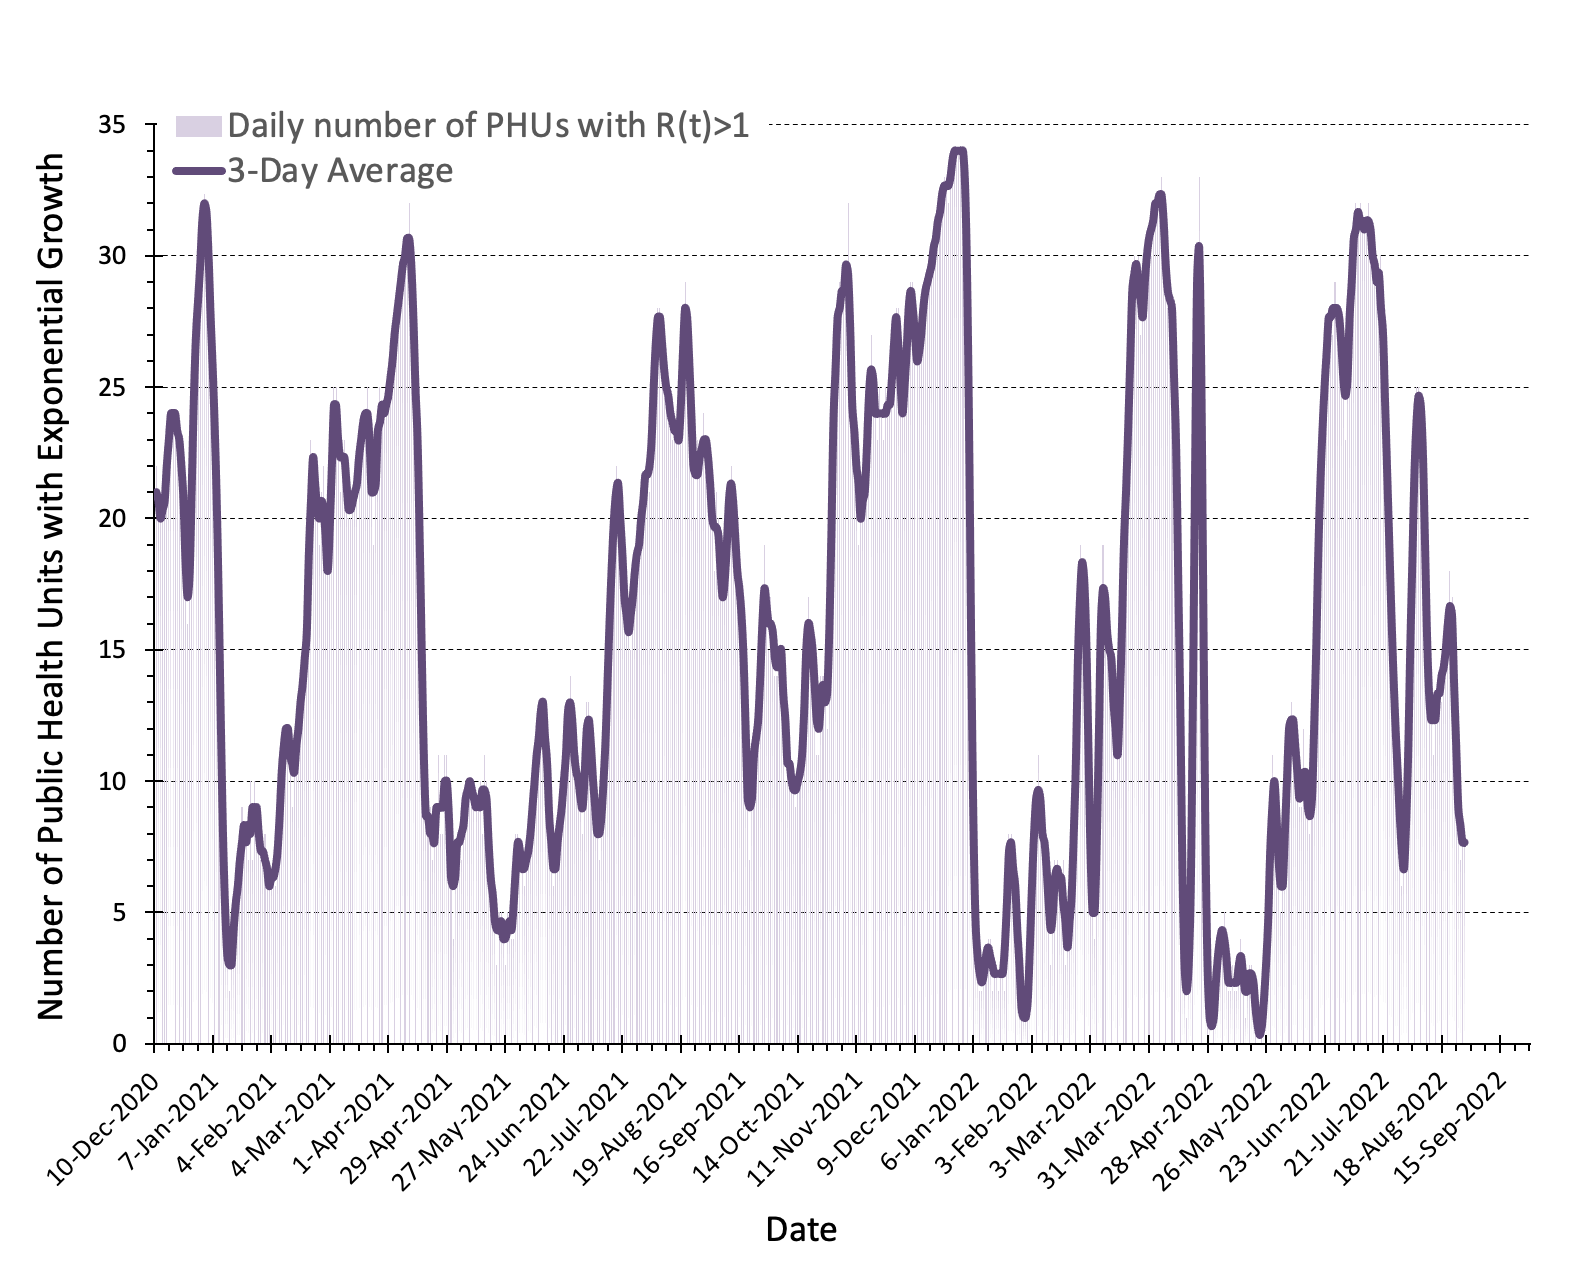
Number of Public Health Units With Exponential Growth in Ontario
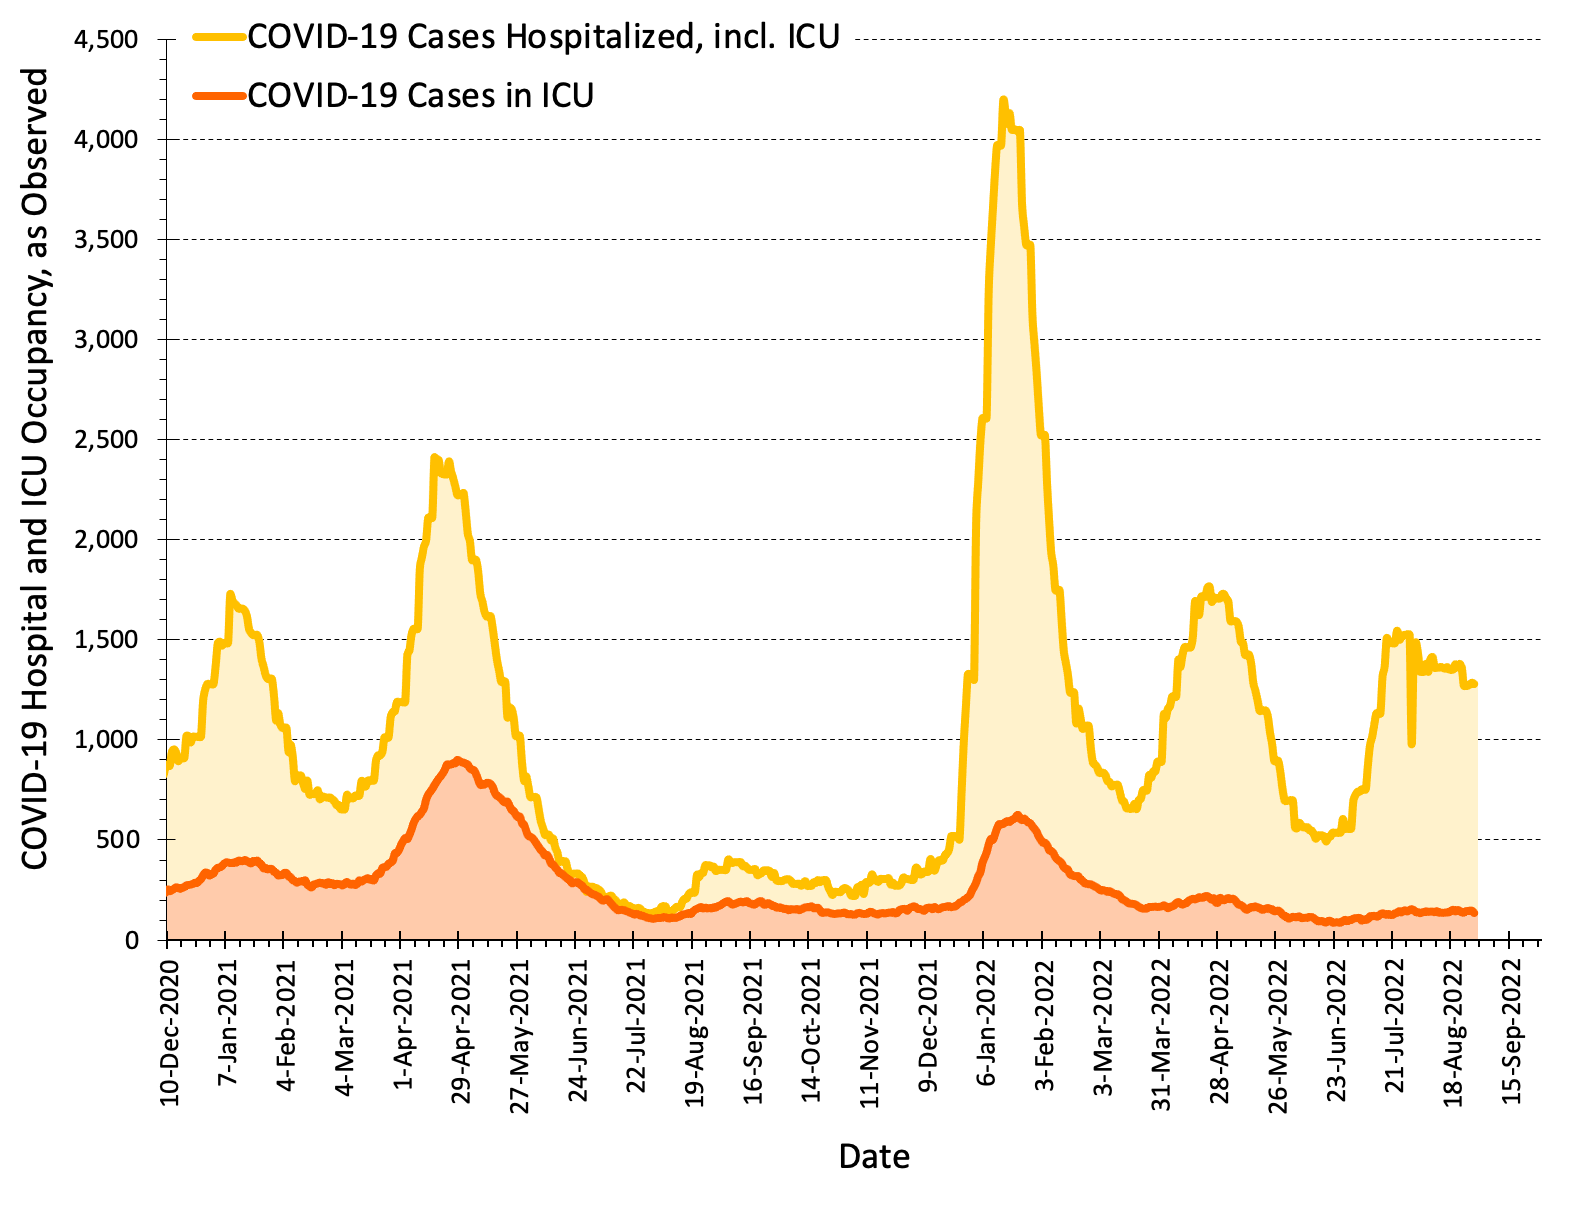
Daily COVID-19 Hospital and ICU Occupancy in Ontario
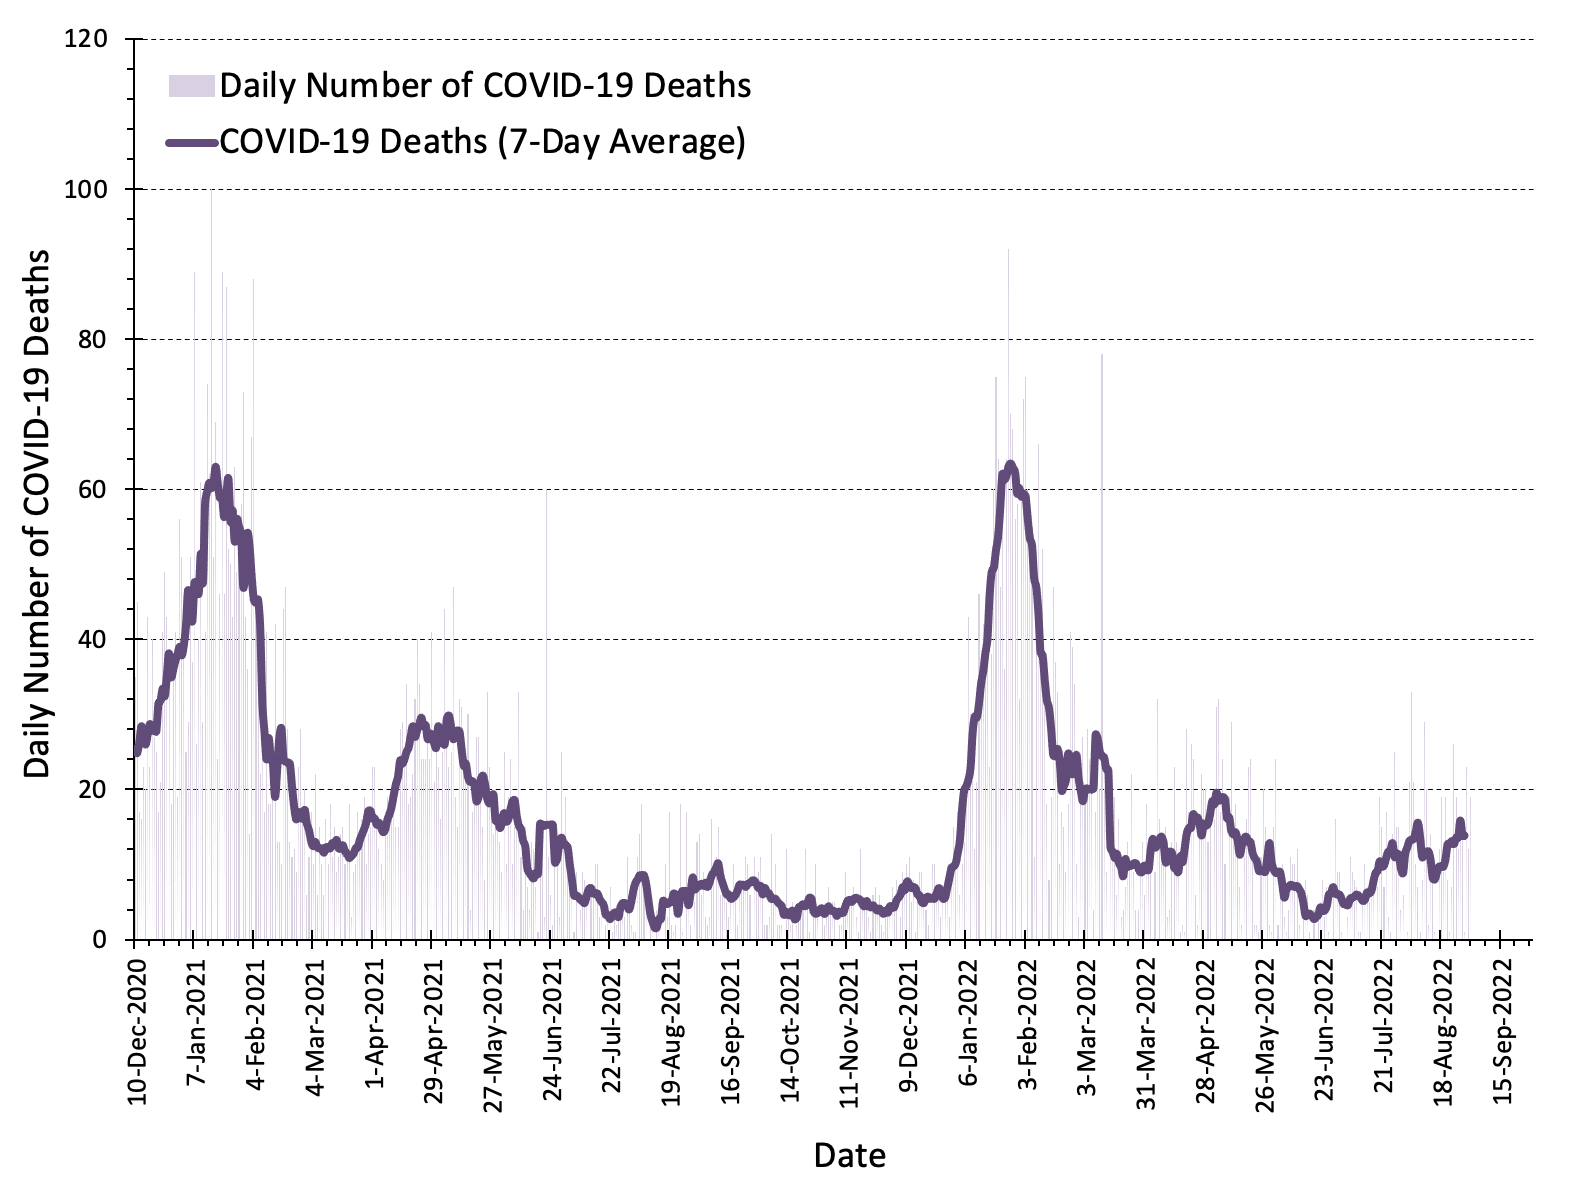
Daily COVID-19 Deaths in Ontario
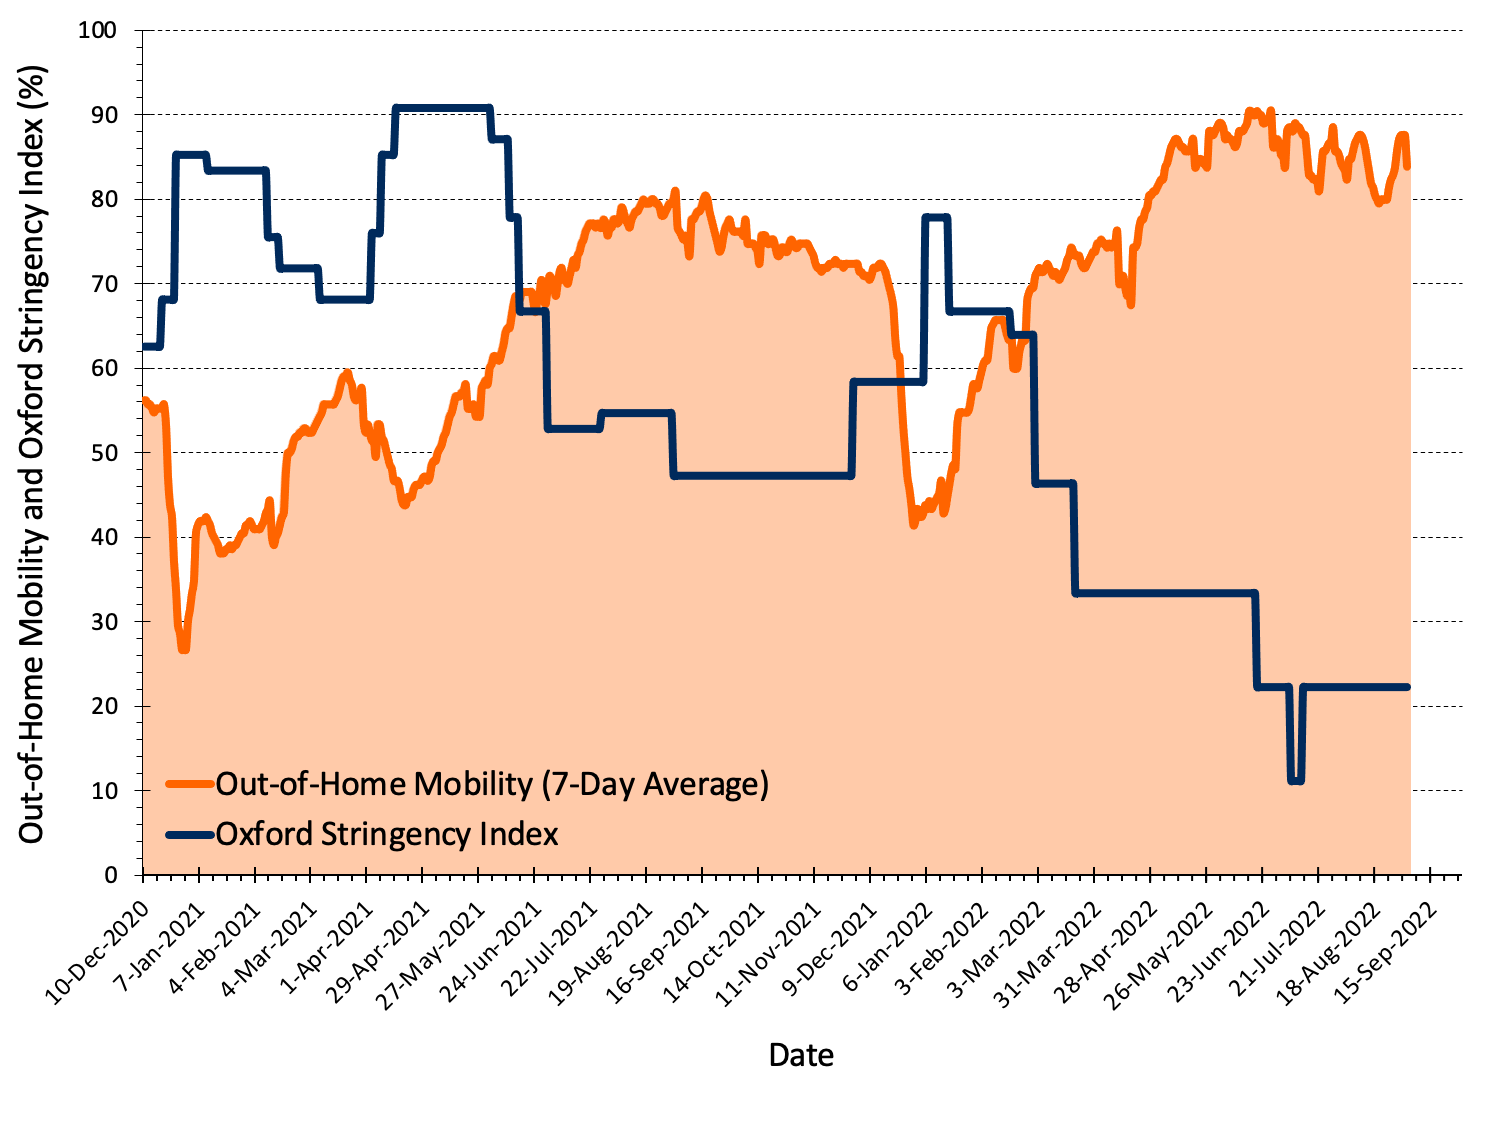
Oxford Stringency Index and Out-of-Home Mobility in Ontario
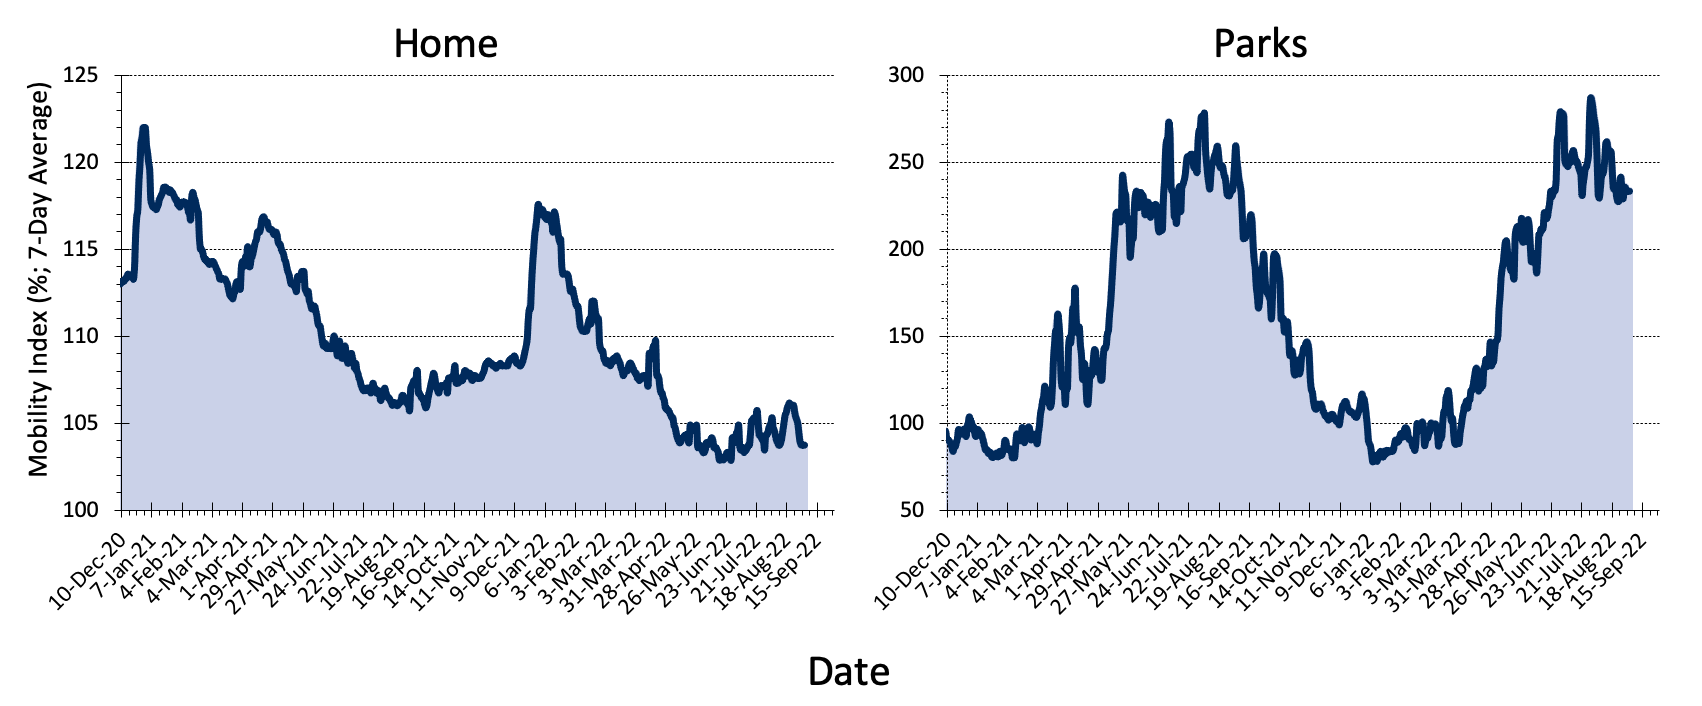
Mobility Indicators of Low-Risk Activities in Ontario
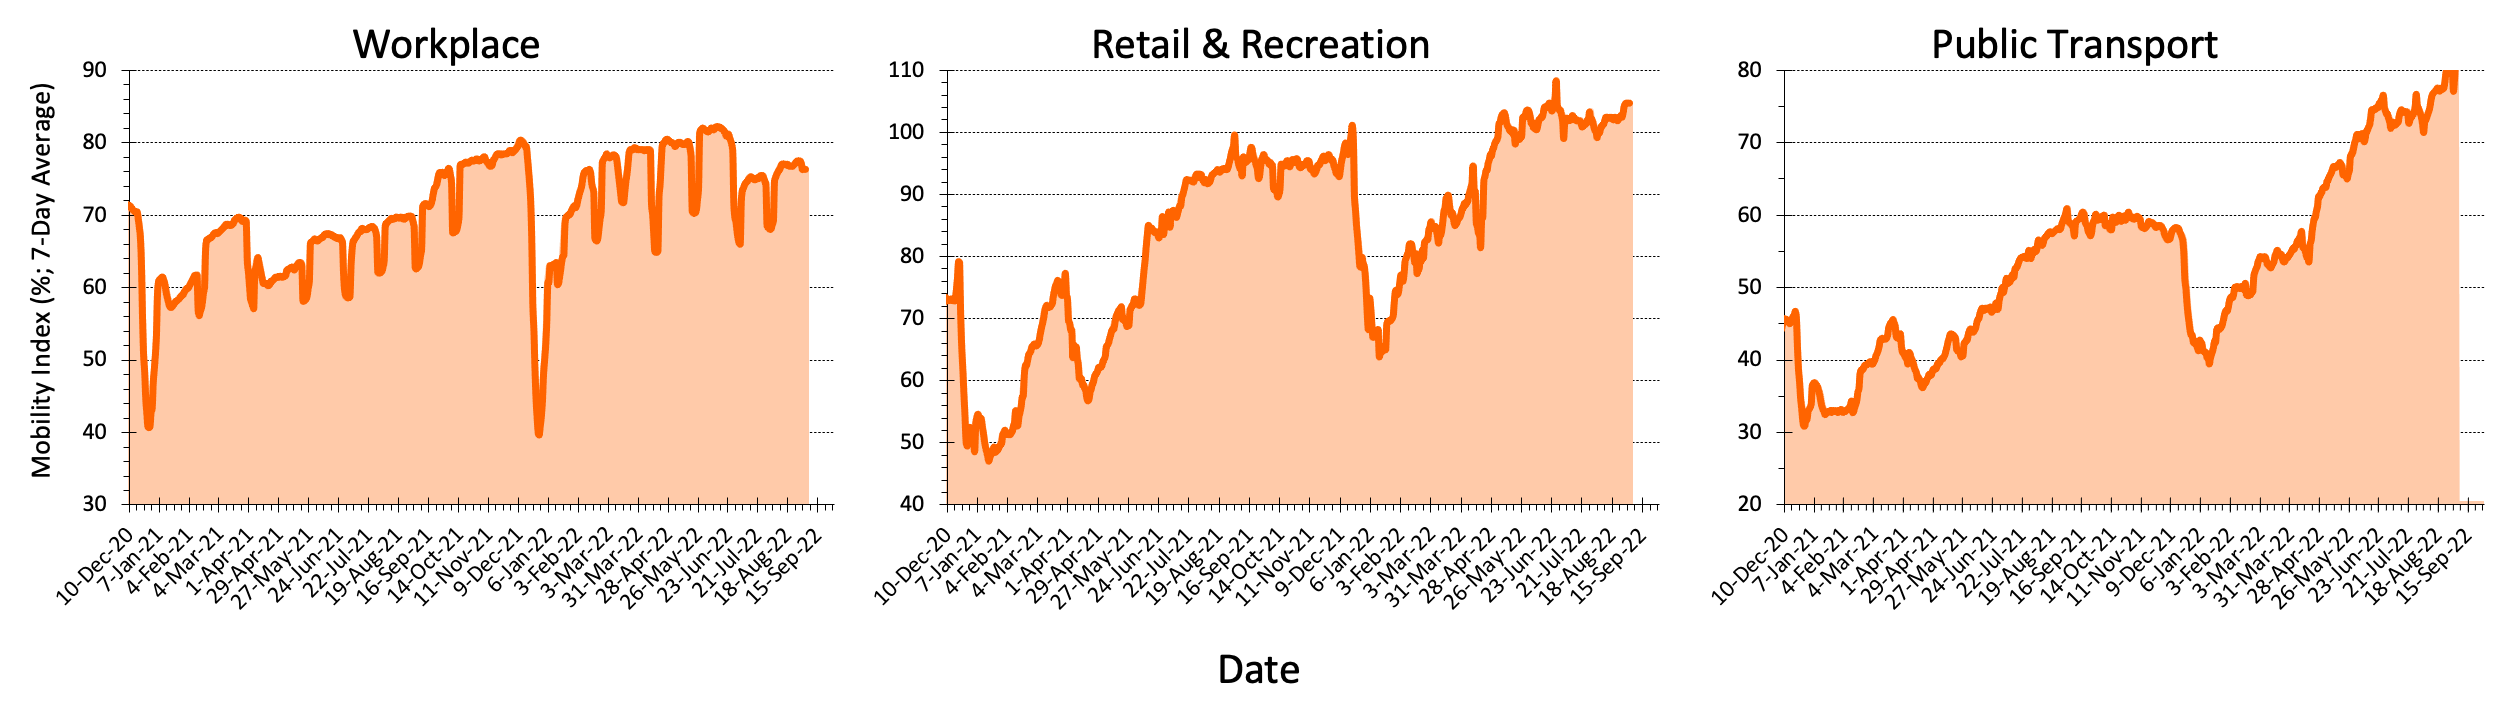
Mobility Indicators of High-Risk Activities in Ontario
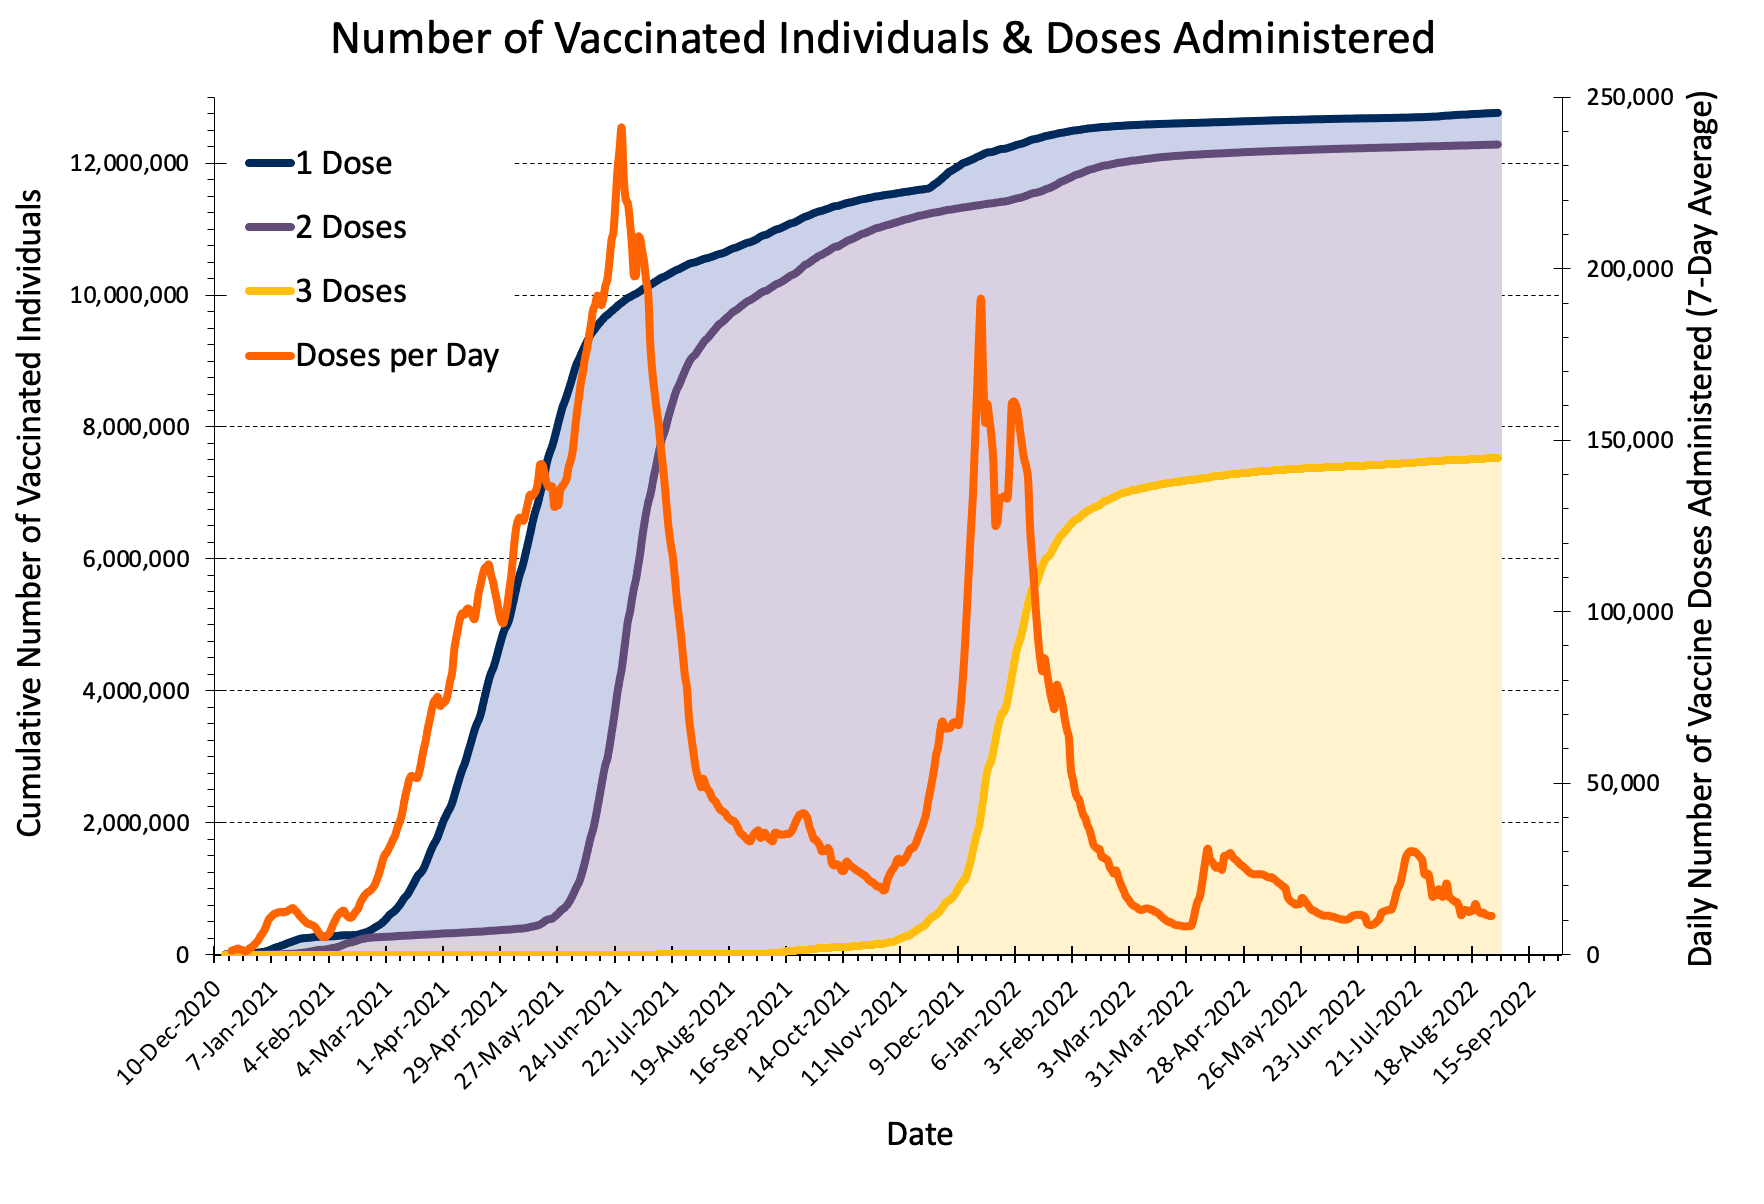
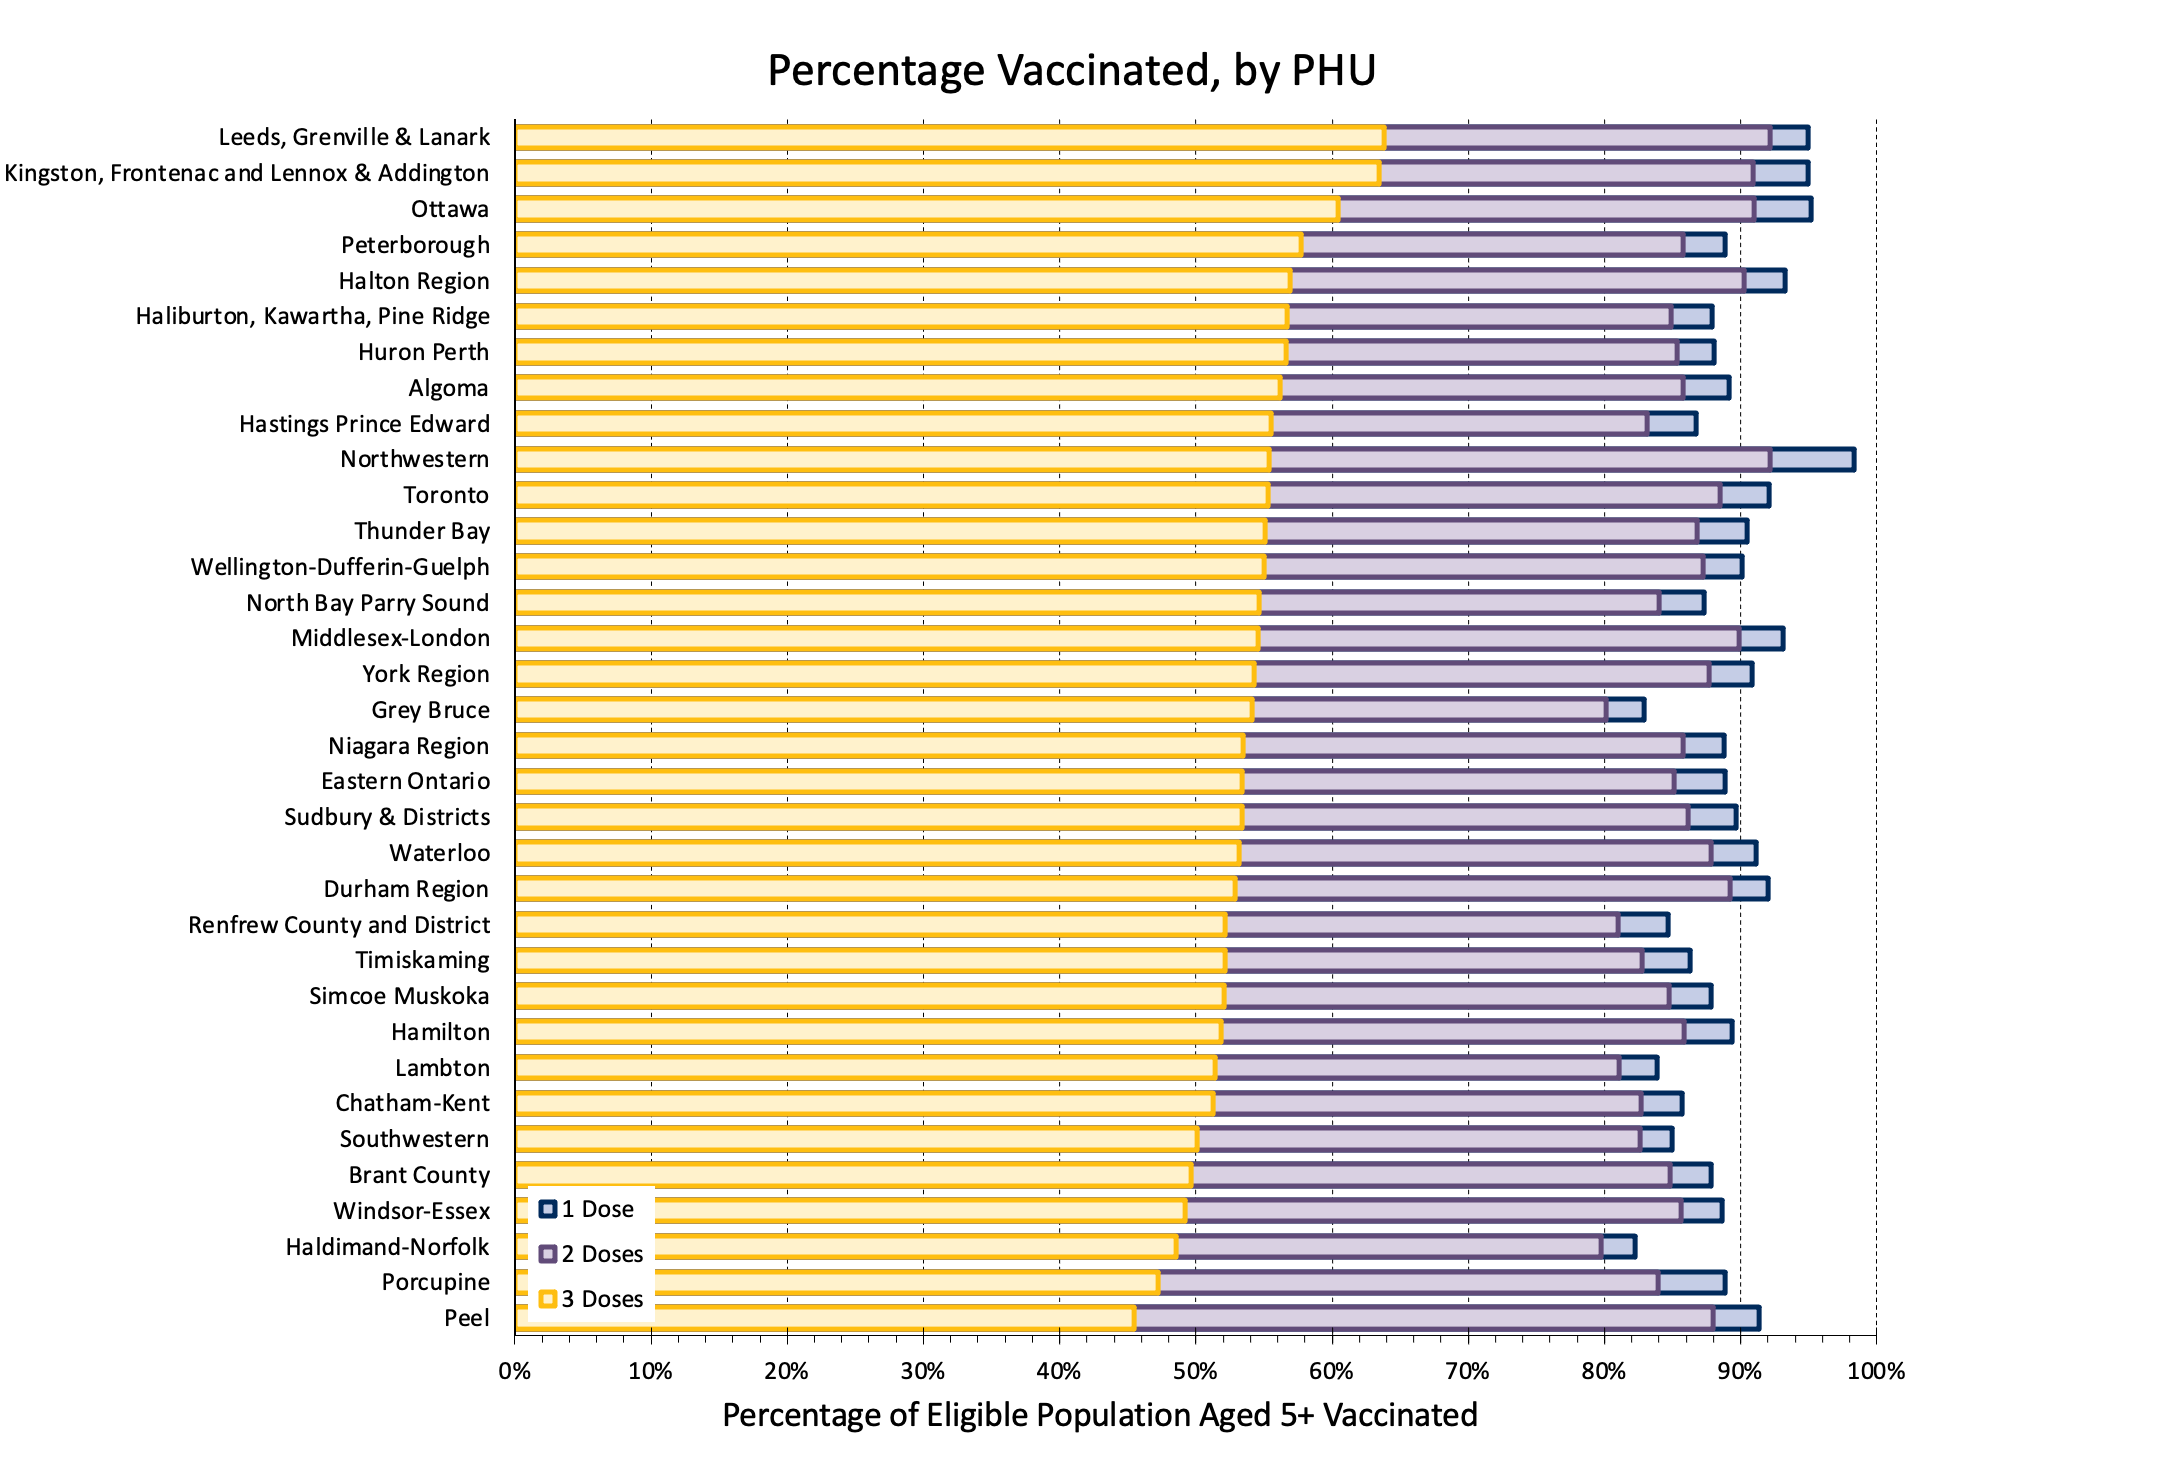
COVID-19 Vaccination in Ontario
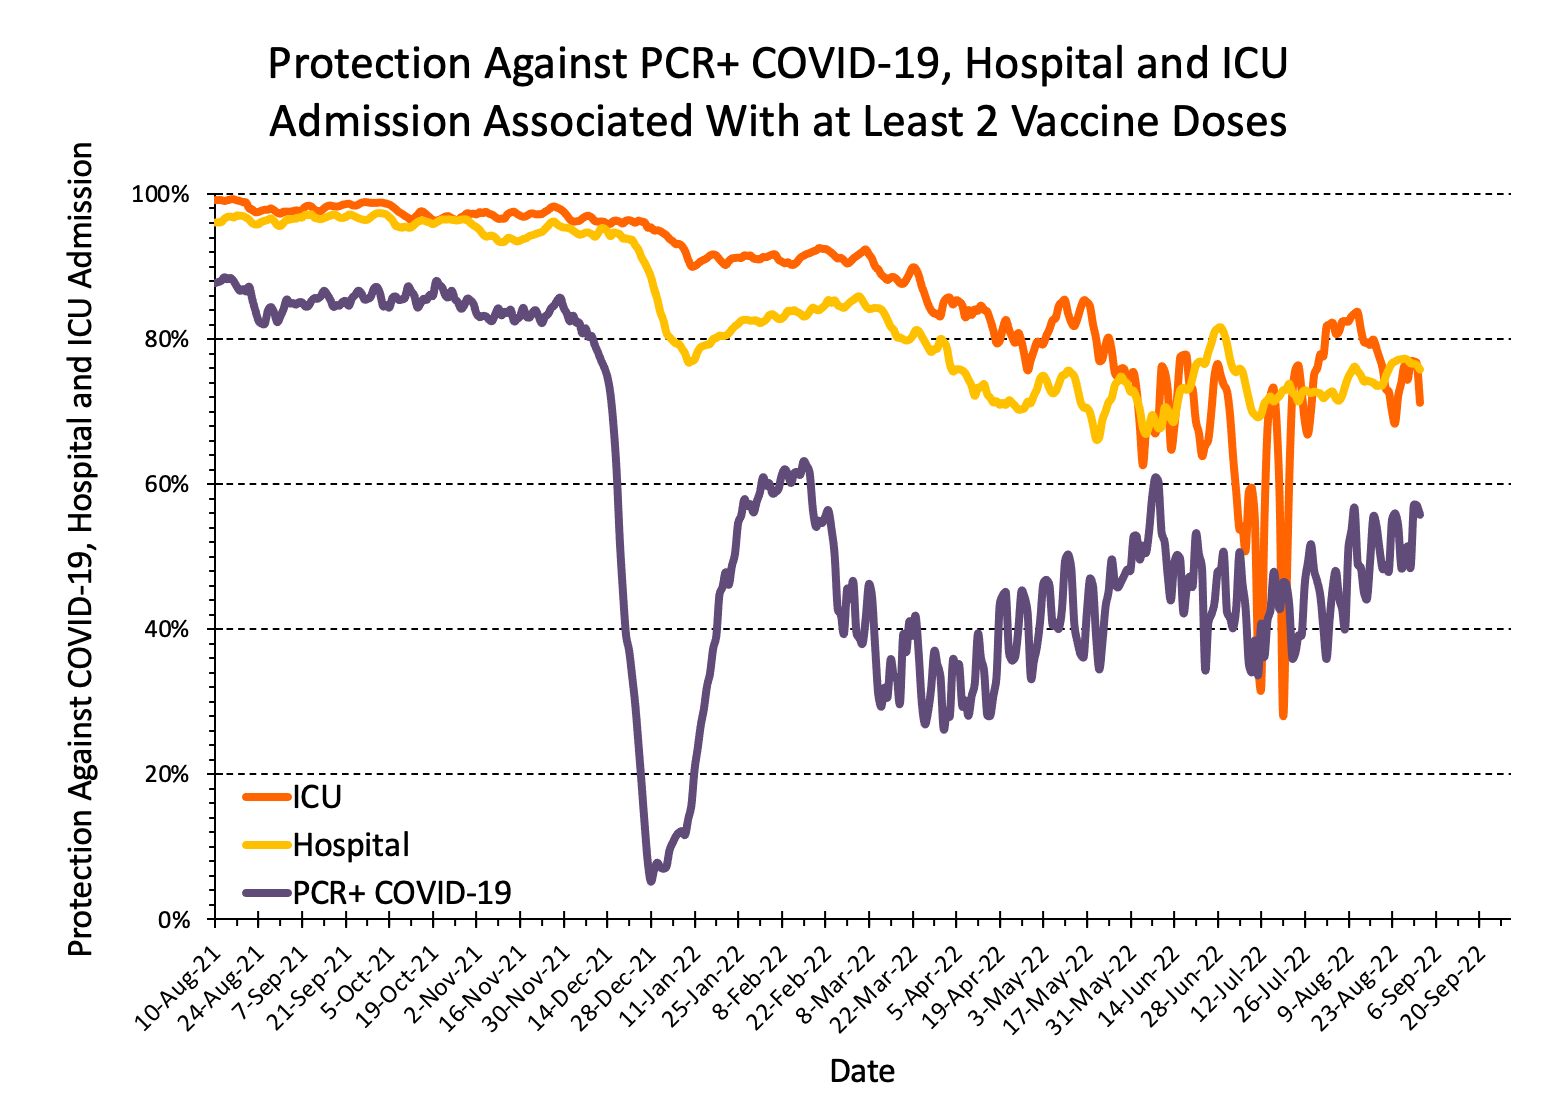
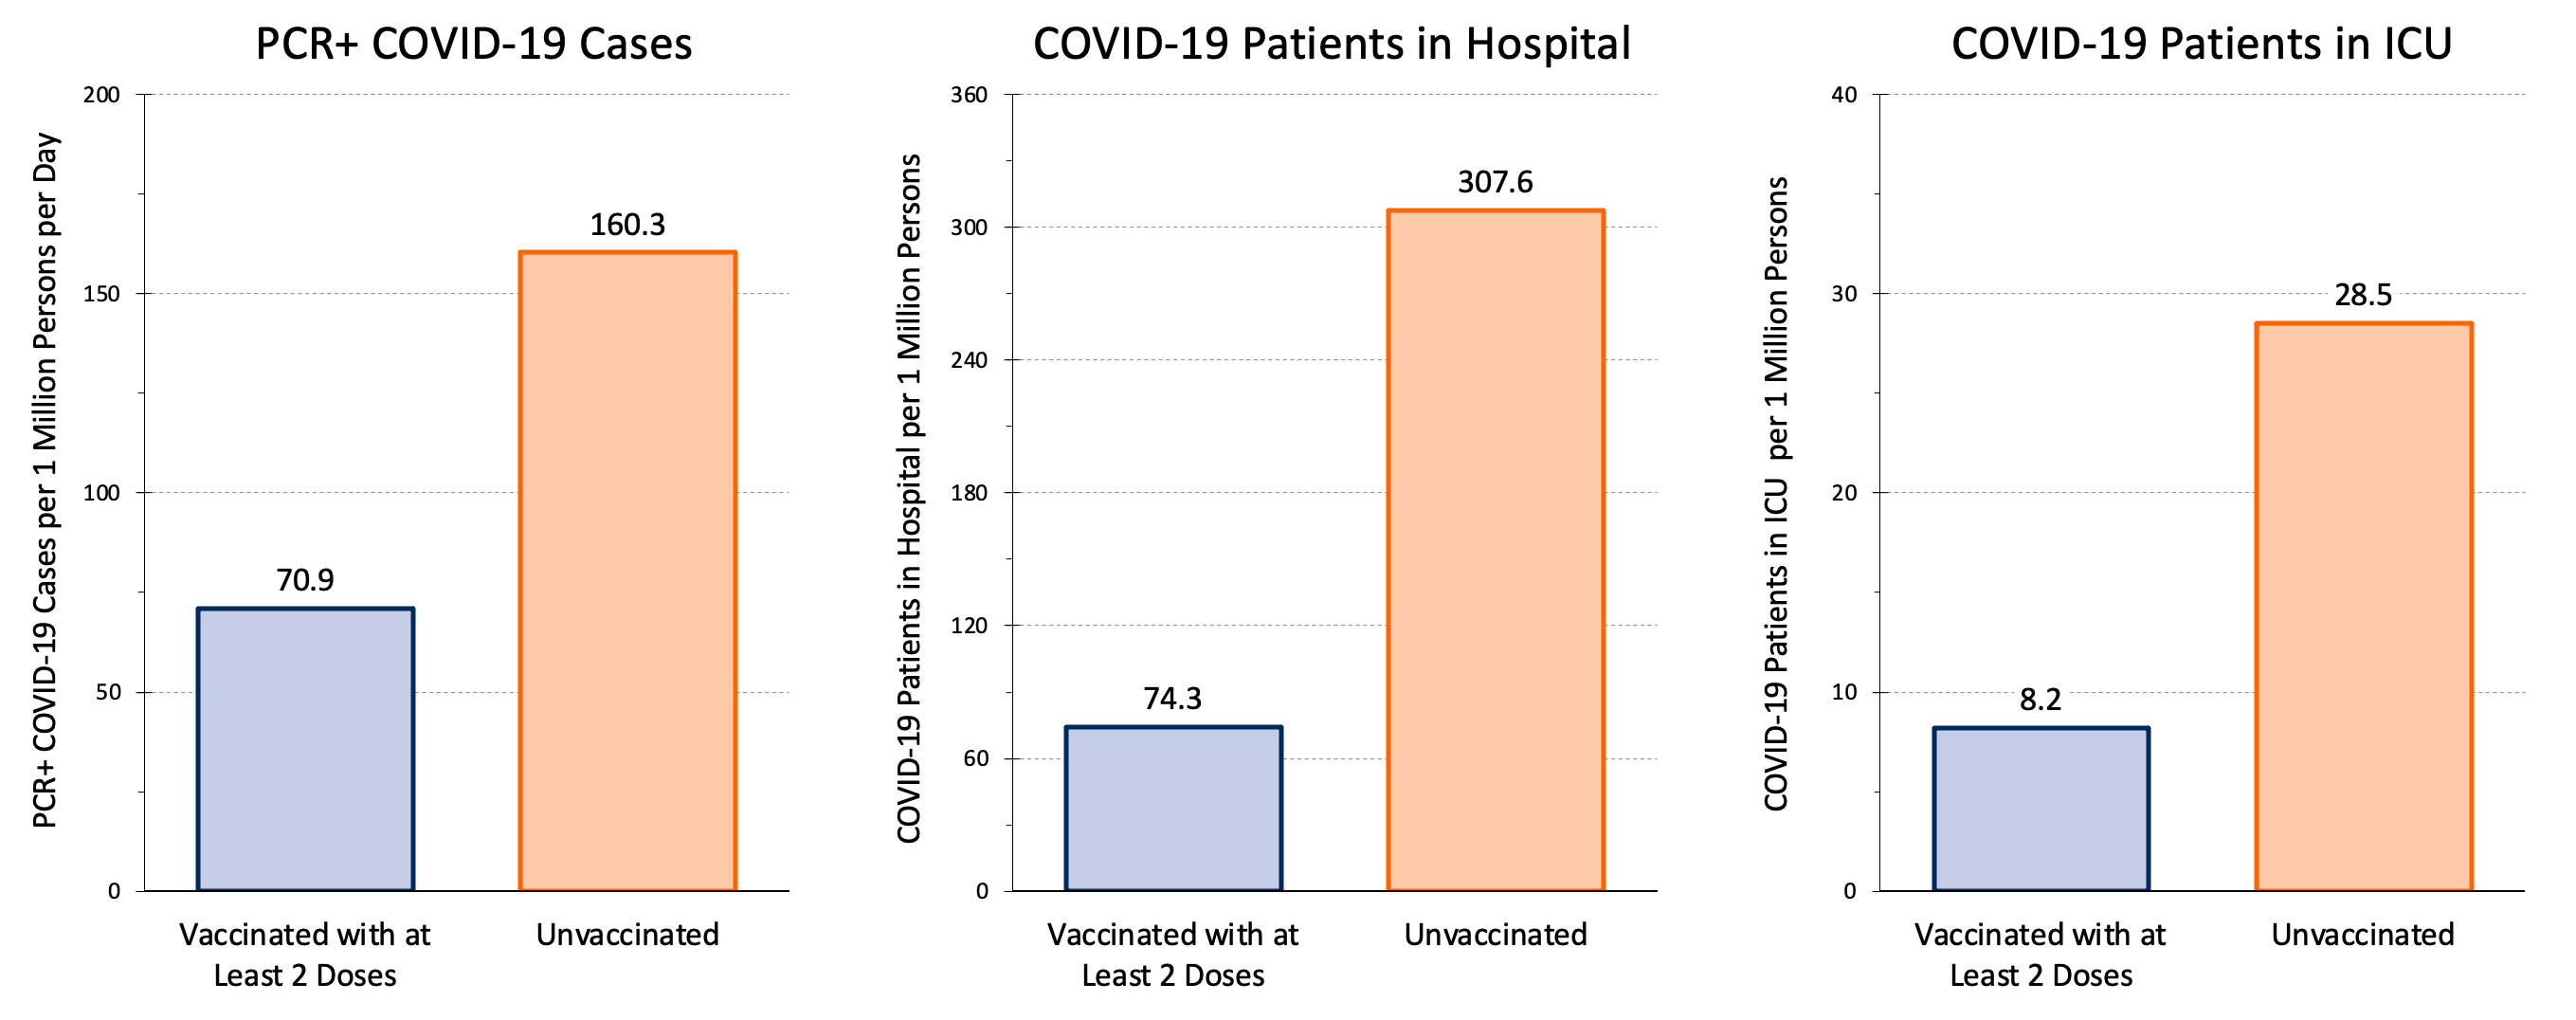
Current COVID-19 Risk in Ontario by Vaccination Status
COVID-19 Wastewater Signals in Ontario

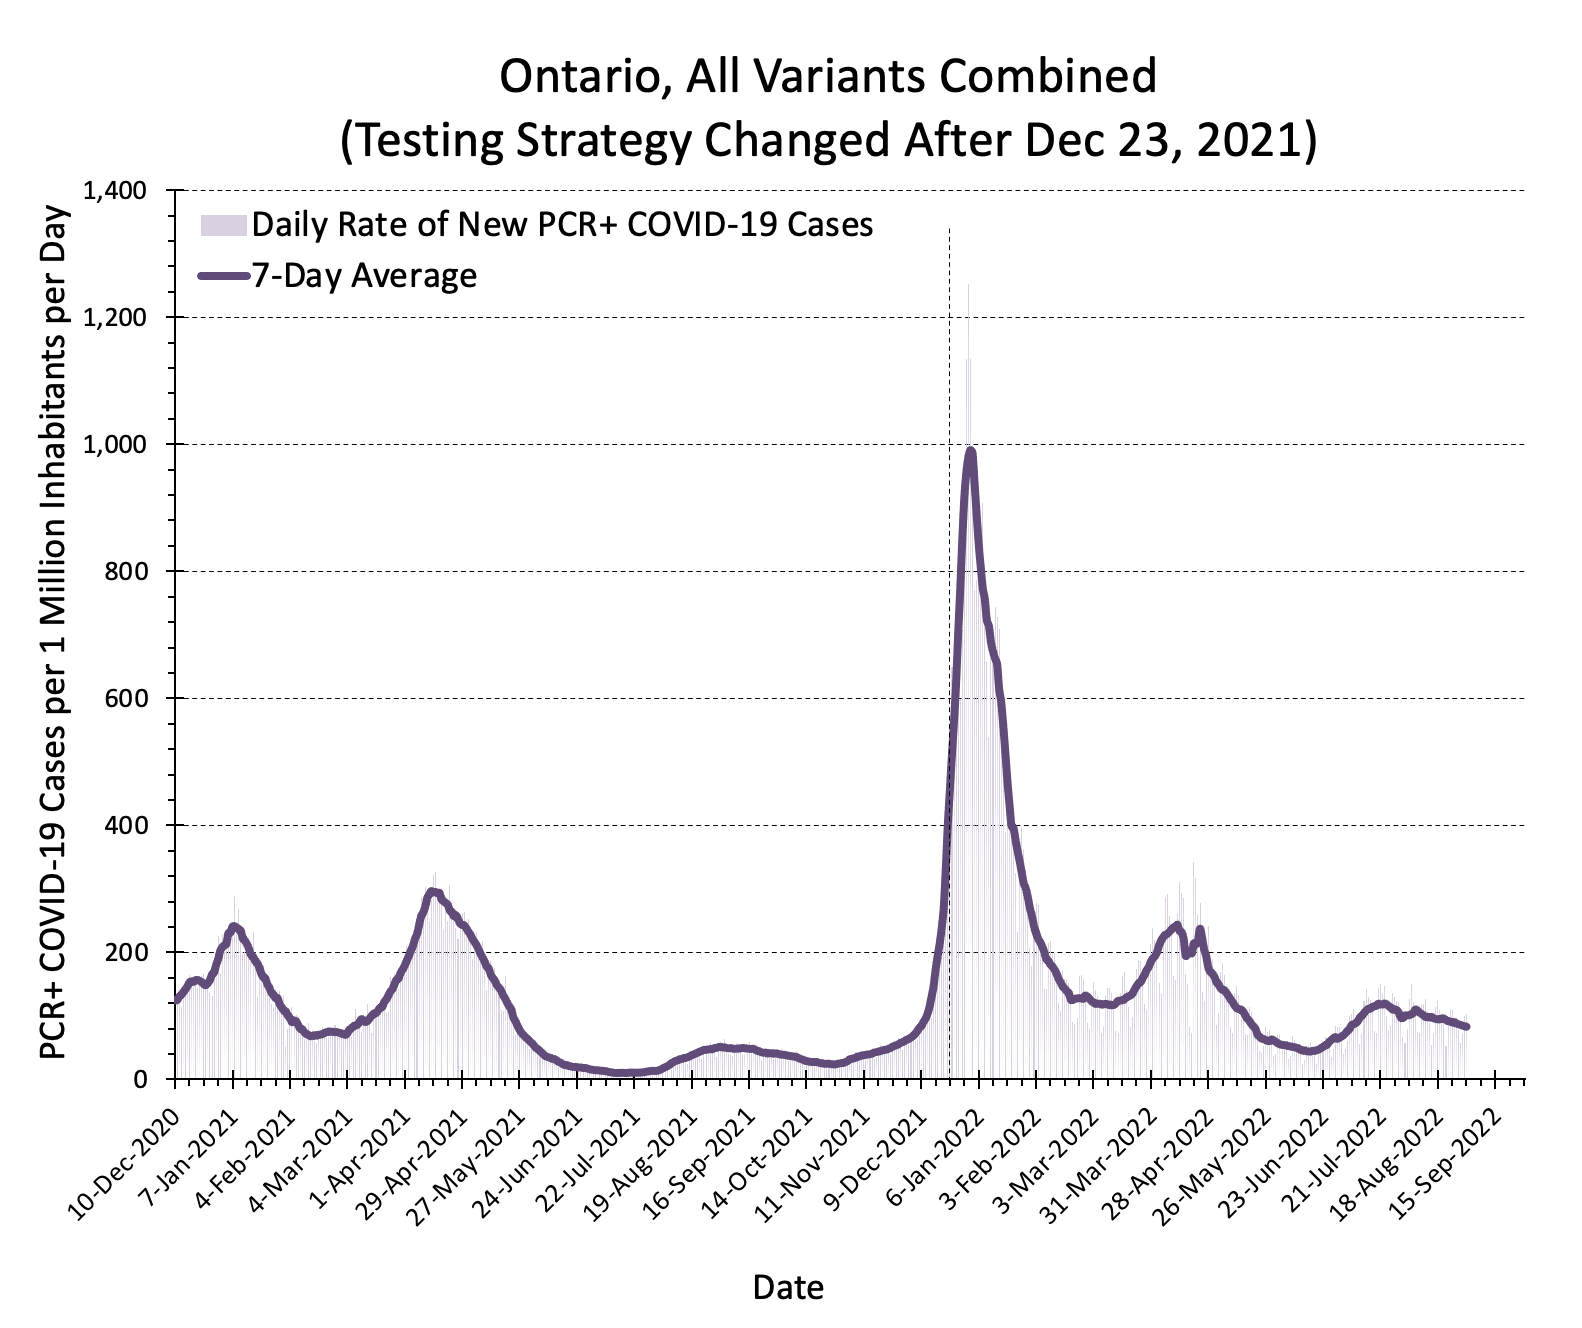
Estimated Rate of COVID-19 Cases per 1 Million Inhabitants per Day in Ontario
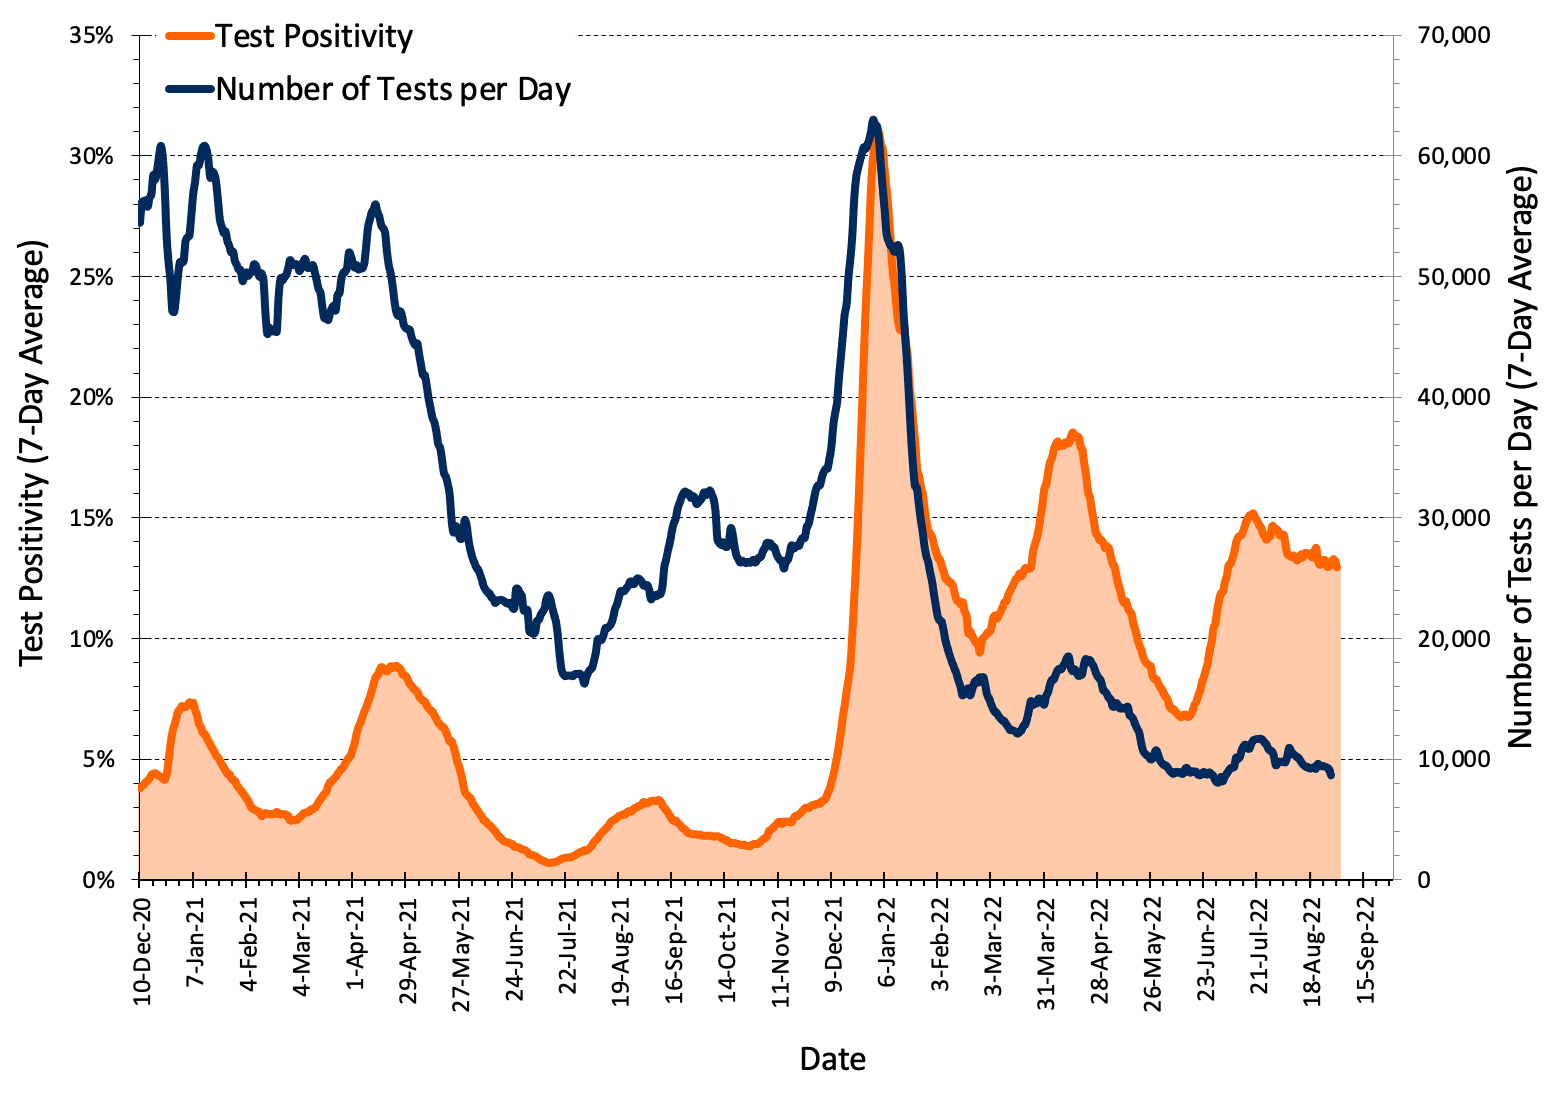
Test Positivity and Number of COVID-19 Tests in Ontario
Effective Reproduction Number R(t) in Ontario
Percentage of Cases Caused by Different Variants in Ontario
Number of Public Health Units With Exponential Growth in Ontario
Daily COVID-19 Hospital and ICU Occupancy in Ontario
Daily COVID-19 Deaths in Ontario
Oxford Stringency Index and Out-of-Home Mobility in Ontario
Mobility Indicators of Low-Risk Activities in Ontario
Mobility Indicators of High-Risk Activities in Ontario
COVID-19 Vaccination in Ontario

Data sourced from:
https://covid19.apple.com/mobility/
https://ourworldindata.org/explorers/coronavirus-data-explorer
Public Health Case and Contact Management Solution and other case management systems (CCM plus)
https://www.google.com/covid19/mobility/
Wastewater Dashboard hosted by Ontario’s Ministry of the Environment, Conservation and Parks (MECP)
Citation:
Jüni P, da Costa BR, Maltsev A, Katz GM, Perkhun A, Yan S, Bodmer NS. Ontario dashboard. Science Briefs of the Ontario COVID-19 Science Advisory Table. 2021. https://doi.org/10.47326/ocsat.dashboard.2021.1.0