Key Message
The number of SARS-CoV-2 infections in Ontario has progressively increased in September and October 2020. There is new evidence that suggests that indoor spaces where masks cannot be worn at all times and/or where it is difficult to maintain physical distancing are important risk factors for the transmission of SARS-CoV-2. Targeted public health measures in regions with high transmission are needed to avoid further increases in COVID-19 cases and to avoid more stringent public health prevention measures in the future.
Summary
Background
After low daily numbers of recorded cases with SARS-CoV-2 infection in July and August 2020, the number of patients testing positive in Ontario has steadily increased since the beginning of September 2020.
Questions
What is the current and projected incidence of SARS-CoV-2 infection in Ontario?
How pronounced are the differences between regions with high, moderate and low rates of transmission?
What is the current and projected hospital and ICU bed occupancy related to SARS-CoV-2 infection in Ontario?
What is the evidence for the contribution of restaurants, bars, and other indoor venues to the current second wave in Ontario?
Findings
The number of patients testing positive for SARS-COV-2 infection in Ontario has steadily increased since September 2020. The rise in case numbers is not an artifact of increased testing. Test positivity has increased substantially, and the pattern over time suggests spread of SARS-CoV-2 infections to older age groups at higher risk of poor outcomes.
The occupancy of acute care and ICU beds with COVID-19 patients has more than doubled since the beginning of September 2020. Ontario’s ICU occupancy is predicted to exceed the accepted threshold of 150 beds by the end of October 2020, even in the best-case scenario.
There is considerable variation in rates of transmission across the province. The slope of the second wave in Toronto, Peel and Ottawa (5.6 million inhabitants), with currently high transmission of more than 25 cases with SARS-CoV-2 infection per 100,000 inhabitants per week, is steeper than in the first wave and shows clear exponential growth. There is also an increase in the daily incidence of SARS-CoV-2 infection in regions of moderate transmission, such as York, Halton and Hamilton, but the slope is currently less steep than observed in Toronto, Peel and Ottawa, and less steep than observed for these regions during the first wave.
Targeted public health interventions aimed at environments or locations associated with increased transmission of SARS-CoV-2 infection may help achieve public health goals and avoid stricter measures in the future. For instance, data from Toronto Public Health and a case-control study from the United States suggest that indoor venues where it is not possible to wear masks and/or maintain physical distance are an important source of SARS-CoV-2 transmission. These include indoor dining locations, bars, and entertainment venues. Reducing patronage in these venues in regions with high transmission is expected to curb the increase in SARS-CoV-2 transmission.
Comparative evidence from other countries suggests that early targeted public health interventions can prevent the need for more stringent public health measures further down the line. Australia and Germany instituted stricter public health interventions after a documented increase in SARS-CoV-2 infection earlier than France and the Netherlands. In Germany, these interventions were of overall moderate stringency but were sufficient to limit the spread of SARS-CoV-2 and obviated the need for stricter measures later.
Interpretation
The current slope of Ontario’s second wave and its corresponding projection closely follow the slope of the second wave in the state of Victoria, Australia, which eventually resulted in a lockdown.
There are an increasing number of outbreaks in Ontario overall, also affecting the more vulnerable populations. Case growth and the spillover of cases in to older and more vulnerable populations will critically hinder Ontario’s health system response capacity.
It is important to balance the public health and harms of any public health interventions aimed at reducing the transmission of SARS-CoV-2. The current best evidence suggests that early, targeted interventions are likely to curb the increase in SARS-CoV-2 transmission while reducing the need for stricter measures in the future.
In regions with high transmission, we therefore recommend restricting indoor activities where it is difficult to wear masks and/or in which physical distancing is difficult to maintain (for example, indoor dining, banquet halls, gyms, bars, clubs and casinos). In addition, people should be encouraged to work from home if possible and to leave home only for essential activities. As the number and extent of school outbreaks have been relatively low until now, schools should be kept open.
In regions with moderate SARS-CoV-2 transmission, the benefit of new public health measures must be balanced against the potential harm of restrictions. The incidence of SARS-CoV-2 infections should be carefully monitored in these regions and additional public health measures introduced if there are more than 25 new SARS-CoV-2 infections per 100,000 people per week. In regions with low SARS-CoV-2 transmission, the public health benefit of additional restrictions on indoor venues may not outweigh the consequences.
Full Text
Background
After low numbers of daily recorded cases of SARS-CoV-2 infection in July and August 2020, the number of patients testing positive for SARS-COV-2 infection in Ontario has steadily increased since the beginning of September 2020.
Questions
What is the current and projected incidence of SARS-CoV-2 infection in Ontario?
How pronounced are the differences between regions with high, moderate and low rates of transmission?
What is the current and projected hospital and ICU bed occupancy related to SARS-CoV-2 infection in Ontario?
What is the evidence for the contribution of restaurants, bars, and other indoor venues to the current second wave in Ontario?
Findings
Figure 1 presents a comparison of 7-day moving averages of second waves between two jurisdictions with similar population sizes, urban population density, economic situation and health care system, Victoria, Australia and Michigan, United States, and between the first and second waves of the COVID-19 pandemic in Ontario. The slope of Ontario’s second wave until October 5, 2020, and the corresponding 14-day projection closely follow the slope of the actual second wave in the state of Victoria, Australia, which eventually resulted in a lockdown. With a current doubling time of 14 days, the slope of Ontario’s second wave is considerably steeper than the slope of Ontario’s first wave and also steeper than the beginning of the second wave in Michigan, United States.
Predictions for the 7-day average of the incidence of SARS-CoV-2 infection, based on data accumulated until October 5, 2020, suggest that the incidence of new confirmed SARS-CoV-2 infections is likely to reach 1,200 cases per day around October 19, 2020, in the absence of more stringent public health measures prior to October 10, 2020. Due to an average incubation period of approximately 5 days1 and time lags between symptom onset and the confirmation of SARS-CoV-2 infection by PCR test, it will take approximately 10 to 12 days before the impact of new public health measures on the number of confirmed SARS-CoV-2 infections can be observed.
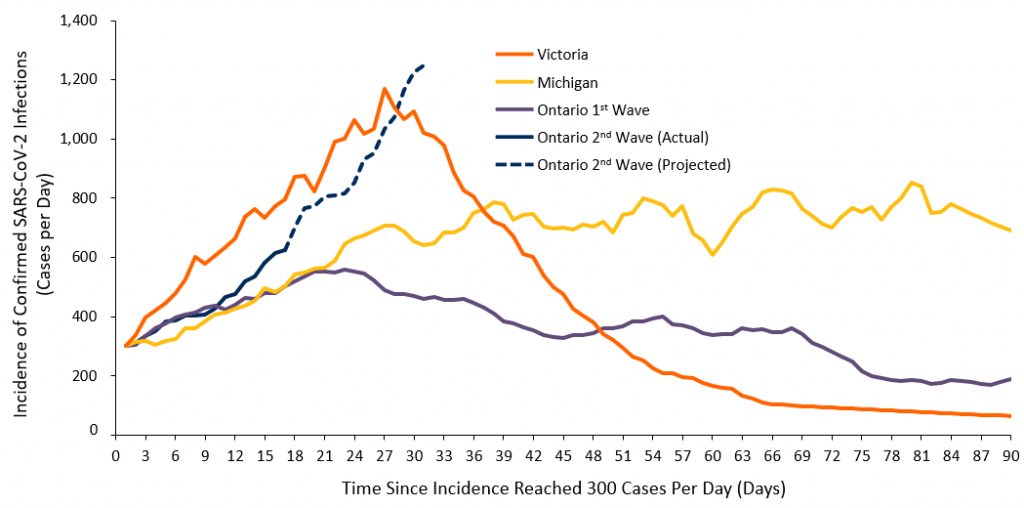
7-day moving averages of confirmed new SARS-CoV-2 infections per day during the first and second waves in Ontario (14.7 million inhabitants) and during the second waves in two jurisdictions with similar population sizes, urban population density, economic situation and health care system, Victoria, Australia (6.7 million inhabitants) and Michigan, USA (10.0 million inhabitants). Curves are aligned to start when the 7-day moving averages reached 300 cases per day; day 1 for Ontario’s second wave corresponds to September 18, 2020. The number of cases in Victoria is standardized to the size of Ontario’s population to achieve direct comparability between Victoria and Ontario. The prediction for Ontario’s second wave (dashed line) is based on a 14-day doubling time. Note that the absolute number of confirmed new SARS-CoV-2 infections per day cannot be directly compared between Ontario’s first and second waves as the number of tests done in Ontario during the second wave is considerably higher than the number of tests done during the first wave; the focus should therefore be on the slope, which is steeper during the second wave than during the first wave. Figure adapted from the COVID-19 Modelling Collaborative (Sander B, personal communication).
The rise in daily cases of confirmed SARS-CoV-2 infections is not merely an artifact caused by increased testing in the province. Figure 2 shows the percentage of positive tests between July 1 and October 5, 2020, presenting a rise in the percentage of positive tests which would not be observed if the rise in cases were a product of an increased number of tests per day. The percentage of people testing positive is rising quickly, with several regions in the province recording a test positivity above 3%, an internationally accepted benchmark used to distinguish regions with and without sufficient control of the pandemic and adequate testing capacity.
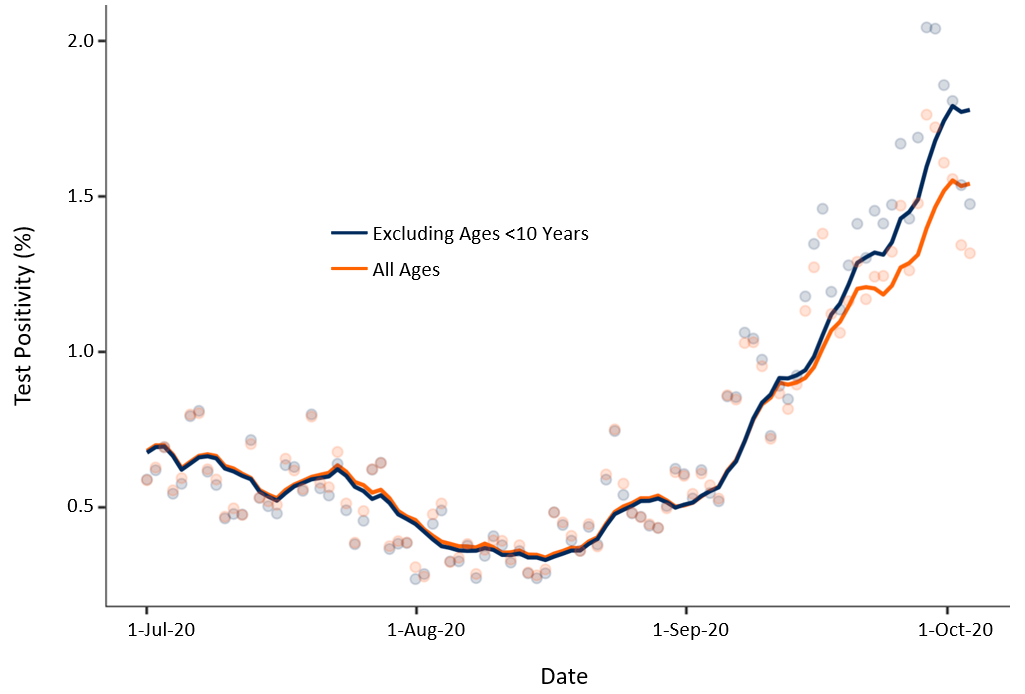
Percentage of positive SARS-CoV-2 tests in Ontario between July 1 and October 5, 2020. Shown are percentages of positive tests for all tested individuals (orange line) and the percentage of positive tests after exclusion of individuals aged less than 10 years (blue line). Figure by Tuite A (personal communication).
Figure 3 shows the percentage of positive tests by age group and calendar week. Although the current increase in SARS-CoV-2 infections has been most pronounced among young adults aged 20 to 29 years in September 2020, the pattern over time suggests a spread of infections to older age groups who are at a higher risk of poor outcomes, and are more likely to require healthcare services, hospitalization, and ICU beds.
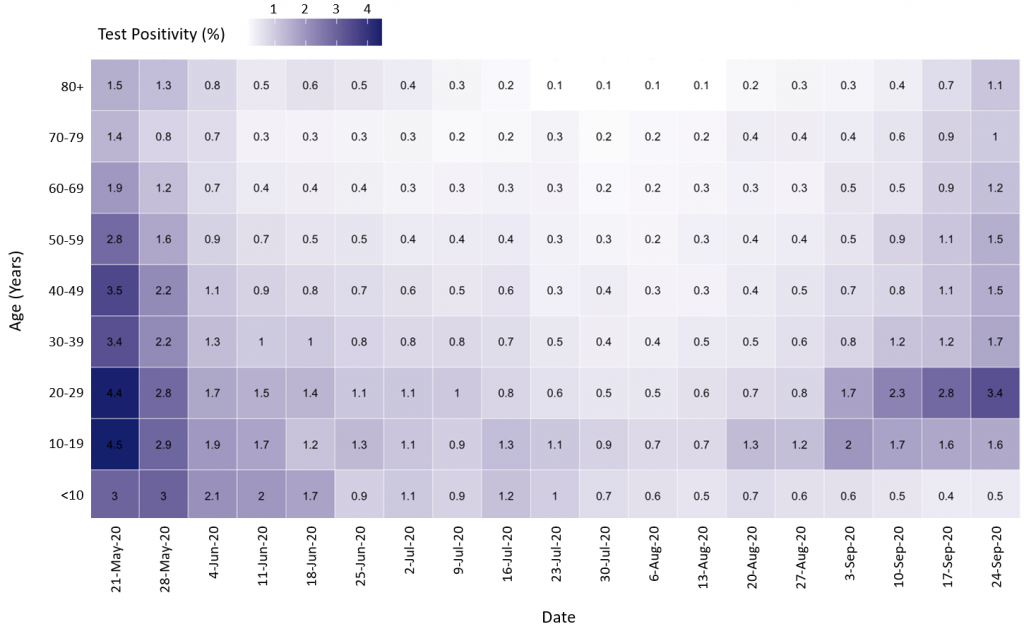
Heat map of the percentage of positive tests by age group and calendar week from the week of May 21 to September 24, 2020. Darker purple represents a higher percentage of positive tests, while the lighter purple represents a lower percentage of positive tests. Percentages are based on 7-day averages. Figure by Tuite A (personal communication).
Increased transmission in the community also results in an increased risk of outbreaks in long-term care homes. Figure 4 shows the number of outbreaks and the number of active cases of SARS-CoV-2 infection among staff and residents in Ontario’s long-term care homes. The number of outbreaks has more than doubled, while the number of active cases has increased more than fivefold among staff, and more than tenfold among residents since the beginning of September 2020.
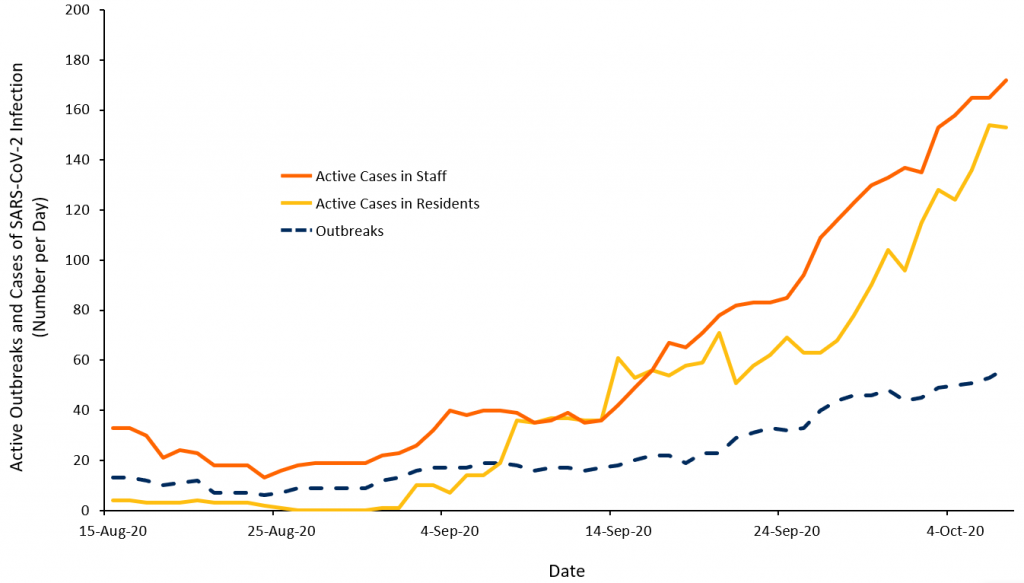
Number of active outbreaks and active cases of SARS-CoV-2 infection among staff and residents in long-term care homes between August 15 and October 4, 2020. Figure adapted from Stall N (personal communication).
The occupancy of acute care and ICU beds will increase with a time lag of several weeks, reflecting the delayed percolation of SARS-CoV-2 infections to more vulnerable populations, as well as the delay between the diagnosis of COVID-19 and its clinical deterioration which will result in hospital or ICU admission. Figure 5 presents the occupancy of acute care and ICU beds with COVID-19 patients in Ontario. The occupancy of acute care and ICU beds more than doubled between the beginning of September and October 4, 2020.
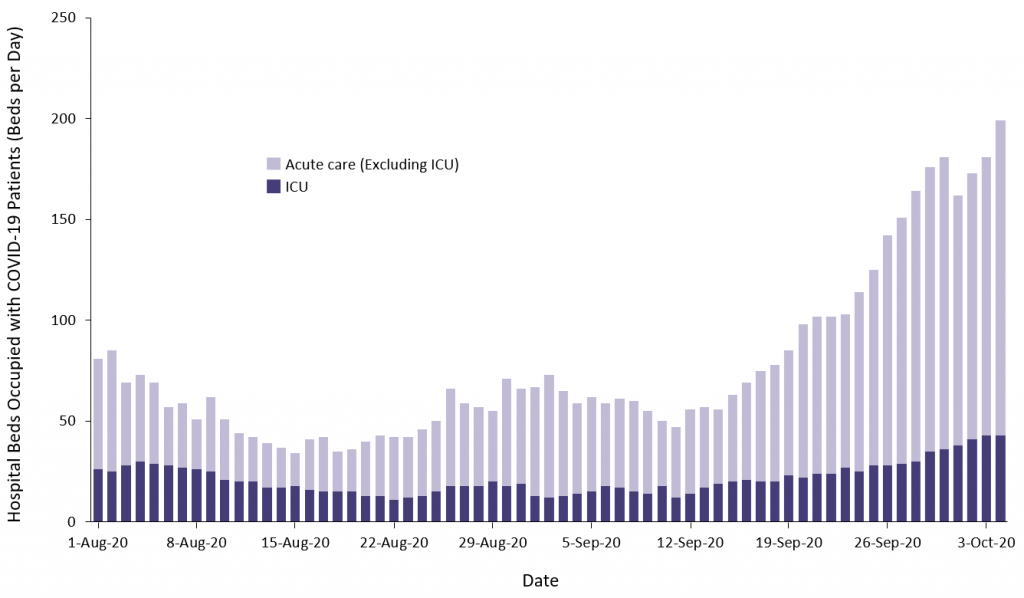
Occupancy of Ontario’s acute care and ICU beds with COVID-19 patients between August 1 and October 4, 2020. ICU, intensive care unit. Figure adapted from Greenberg A (personal communication).
Figure 6 shows predictions for ICU bed occupancy with COVID-19 patients until October 25, 2020, according to three risk scenarios for SARS-CoV-2 transmission. In the absence of more stringent public health measures prior to October 10, 2020, ICU occupancy will likely reach the accepted threshold of 150 beds in Ontario according to all three scenarios by October 25, 2020. This will in turn likely result in cancellations of elective surgical interventions despite already pronounced waitlists.
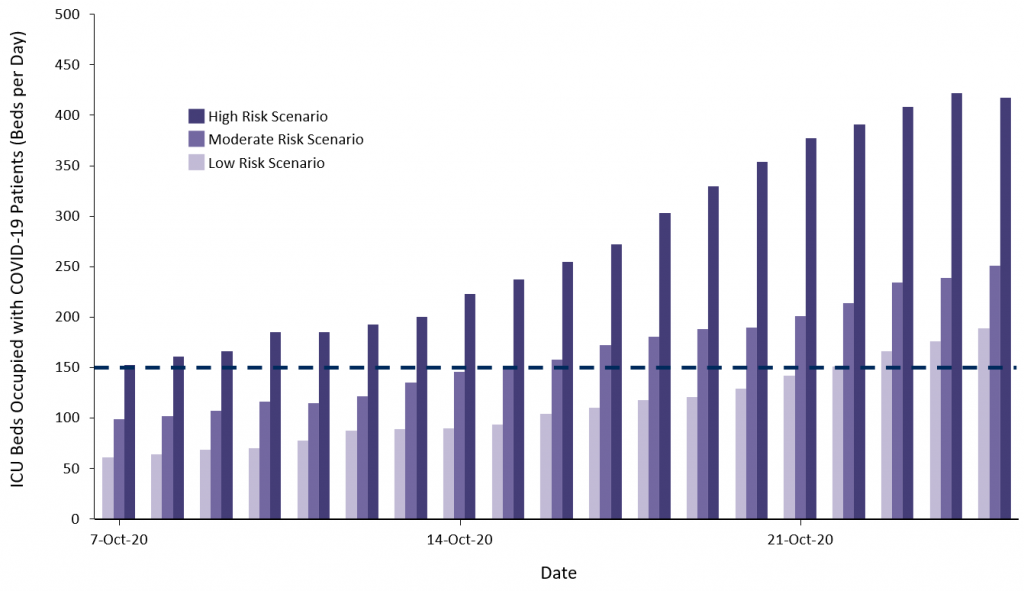
Predicted occupancy of ICU beds in Ontario According to three scenarios. In the low risk scenario, new SARS-CoV-2 infections continue to occur predominantly among young and middle aged adults and the risk of hospitalization per SARS-Co-V-2 infection continues to be similar to the average observed in August and September 2020 in Ontario. The medium risk scenario assumes that new SARS-CoV-2 infections occur in age groups close to Ontario’s average and hospitalizations rates are similar to the average observed between March and August 2020 in Ontario. In the high risk scenario, new SARS-CoV-2 infections occur principally among older adults and hospitalization rates are similar to the average observed in March and April 2020 in Ontario. The dashed line corresponds to the accepted threshold of a 150 ICU bed occupancy with COVID-19 patients in Ontario; below this threshold, elective surgical interventions are likely to be continued at the planned rate. Figure adapted from the COVID-19 Modelling Collaborative (Sander B, personal communication).
There is considerable variation in rates of transmission across the province of Ontario. Figure 7 shows a comparison of 7-day moving averages of second waves between Ontario regions with a current high level of transmission of more than 25 cases with SARS-CoV-2 infection per 100,000 inhabitants per week (Toronto, Peel and Ottawa, 5.6 million inhabitants), regions with a moderate level of transmission of 5 to 25 cases per 100,000 inhabitants per week (7.0 million inhabitants) and regions with a low level of transmission of fewer than 5 cases per 100,000 inhabitants per week (2.2 million inhabitants).
The slope of the second wave in Toronto, Peel and Ottawa is steeper than during the first wave, and shows clear exponential growth. There is also an increase in the daily incidence of SARS-CoV-2 infection in regions of moderate transmission, such as York, Halton and Hamilton, but the slope is currently considerably less steep than the slope observed in Toronto, Peel and Ottawa, and less steep than observed for the first wave in these regions.
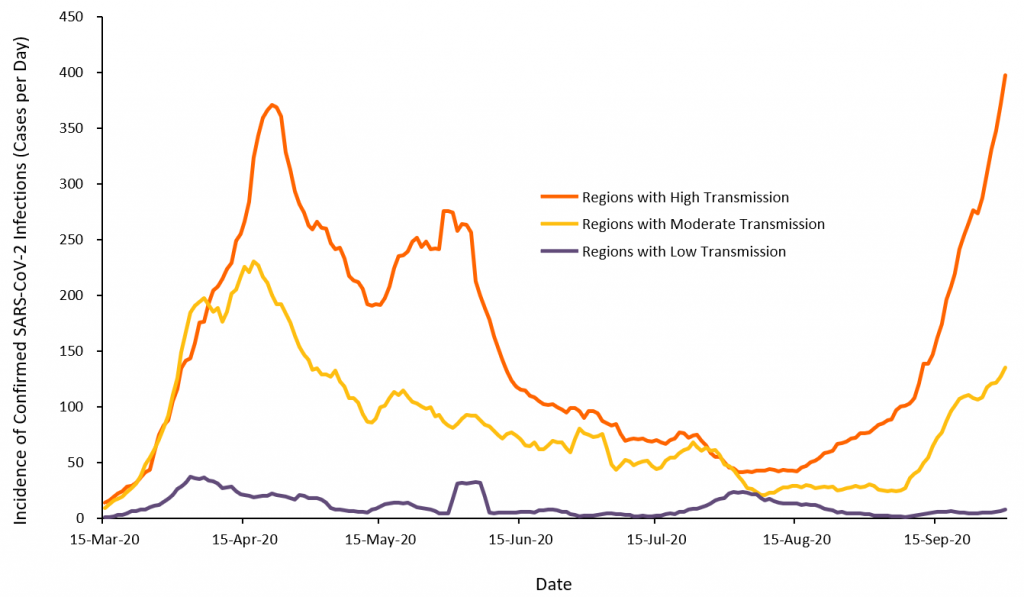
7-day moving averages of confirmed new SARS-CoV-2 infections per day in regions with high, moderate, and low transmission between March 15 and October 5, 2020. Regions with high transmission had more than 25 new SARS-CoV-2 infections per 100,000 people per week during the last week of observation and include the regions of Toronto, Peel and Ottawa. Regions with moderate transmission had between 5 and 25 new SARS-CoV-2 infections per 100,000 people per week and include Kingston, Frontenac and Lennox & Addington, Peterborough, Windsor-Essex, Leeds, Grenville & Lanark, Wellington-Dufferin-Guelph, Brant, Simcoe Muskoka, Durham, Middlesex-London, Hamilton, Niagara, Halton, Eastern Ontario, Waterloo, and York. Regions with low transmission had less than 5 new SARS-CoV-2 infections per 100,000 people per week and include all remaining Public Health Units in Ontario. Note that the absolute number of confirmed new SARS-CoV-2 infections per day cannot be directly compared between first and second waves as the number of tests done during the second wave is considerably higher than the number of tests done during the first wave; the focus should therefore be on the slope, which is currently steeper in regions of high transmission (Toronto, Peel and Ottawa) during the second wave than during the first wave. Data from iPHIS.2 Figure adapted from the COVID-19 Modelling Collaborative (Sander B, personal communication).
Figure 8 shows SARS-CoV-2 RNA levels detected in Ottawa’s wastewater between June 7 and October 10, 2020. Since beginning of September 2020, RNA levels have increased more than fivefold, with a steep increase observed in the two most recent weeks. Since wastewater testing is unaffected by testing backlogs, the observed increase in SARS-CoV-2 RNA levels is likely a more realistic reflection of the current surge in Ottawa than the daily numbers of reported SARS-CoV-2 infections.
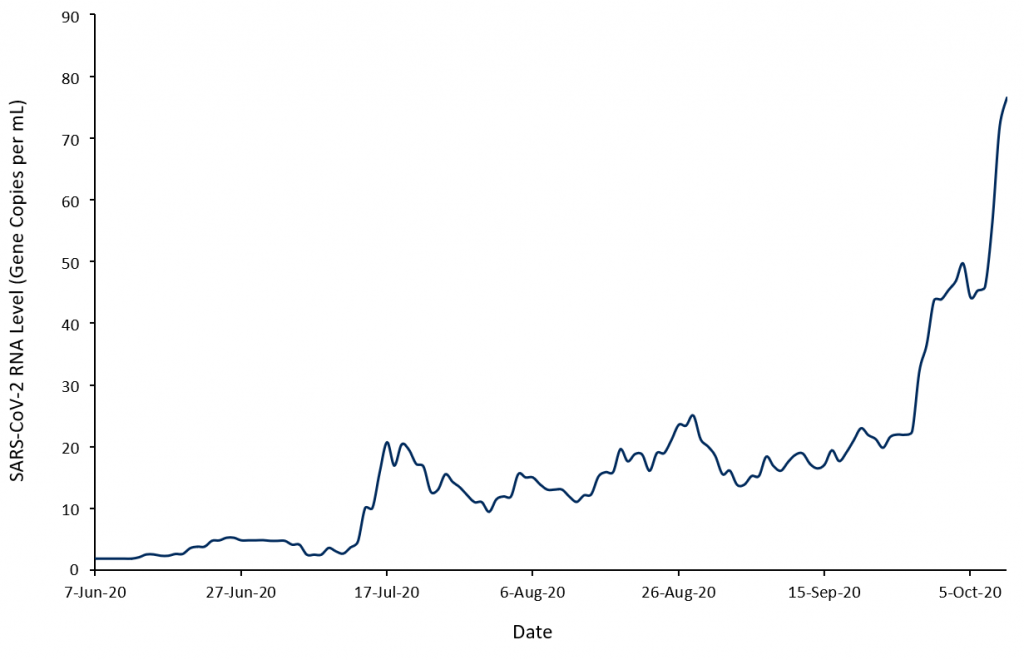
7-day moving averages of SARS-CoV-2 RNA levels in wastewater detected in the City of Ottawa wastewater treatment plant. RNA levels are arithmetic mean levels of N1 and N2 genes in copies per mL adjusted for RNA levels of the pepper mild mottle virus. Figure adapted from Delatolla R (personal communication).
There is local and international evidence to suggest that the transmission of SARS-CoV-2 infection is associated with indoor venues where masks cannot be consistently worn and/or physical distancing is difficult to maintain. These venues include restaurants with indoor dining, bars, coffee shops, and indoor entertainment venues.
Figure 9 presents a breakdown of settings with recently active outbreaks observed in Toronto. Of 119 active outbreaks in Toronto on October 5, 2020, 80 (67%) were associated with community or workplace settings (Panel A). Of 45 active community outbreaks reported by Toronto Public Health between September 20 and 26, 2020, 18 (40%) were tied to restaurants, bars, and entertainment venues (Panel B).3
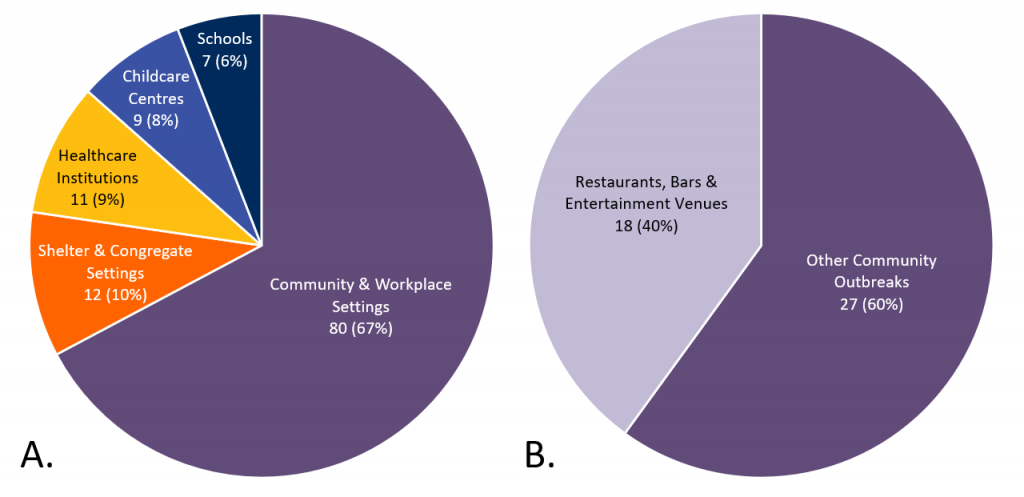
Pie charts describing the setting of all 119 active COVID-19 outbreaks in Toronto as of October 5, 2020 (A), and of all 45 active community outbreaks from September 20 to 26, 2020 (B). Since pie chart A shows a breakdown of COVID-19 outbreaks in Toronto that were considered active as of October 5, 2020, whereas pie chart B shows a breakdown of a subset of 45 community outbreaks that were considered active between September 20 and 26, 2020, pie chart B does not represent a direct subset of pie chart A. Figure based on data provided by Toronto Public Health.3,4
The magnitude of the risk associated with indoor dining in restaurants, bars, and coffee shops was quantified in a case-control study of 314 symptomatic outpatients with suspected COVID-19 from 11 health care facilities in the United States, including 154 cases who were positive for SARS-CoV-2 and 160 controls who were negative. Risk factors associated with SARS-CoV-2 infection in univariate analyses were ethnicity, education, underlying medical conditions, going to locations that offer on-site dining and/or drinking during the two weeks before symptom onset, and previous close contact with a person known to have COVID-19, particularly when this person was part of their family (p-values for these associations ≤0.01). In adjusted analyses restricted to the 225 people who did not have contact with people with known COVID-19, the adjusted odds ratio of being positive for SARS-CoV-2 was 2.8 for dining at a restaurant (95% confidence interval (CI) 1.9 to 4.3) and 3.9 for going to a bar or coffee shop during the previous 2 weeks (95% CI 1.5 to 10.1).5
Figure 10 shows the approximate risks of SARS-CoV-2 infection during the first half of the week of October 11, 2020, in regions with low, moderate, and high levels of transmission under the conservative assumptions that the average doubling time of 14 days applies to all regions in Ontario, that one out of three actual cases of SARS-CoV-2 infection will eventually be detected,6 that 30% of people go to restaurants, bars, and/or coffee shops for indoor dining or drinking, or to an indoor entertainment venue at least once in 2 weeks,5 and that the observed adjusted odds ratio for dining at a restaurant of 2.8 in the U.S. study5 is representative for associations of transmission with indoor dining in restaurants, and visiting bars, coffee shops or indoor entertainment venues in Ontario.
In regions with low transmission, the estimated absolute difference in the risk of transmission between the current situation and a hypothetical scenario with closure of indoor dining in restaurants, bars, coffee shops, and indoor entertainment venues is 0.8 cases per 100,000 inhabitants per day during the first half of the week of October 11, 2020. In regions with moderate transmission, the estimated difference is 4.1 cases per 100,000 inhabitants per day. Conversely, the estimated difference between a scenario with open indoor dining in restaurants, and open bars, coffee shops and indoor entertainment venues and a scenario with closure of these facilities in regions with high transmission (Toronto, Peel and Ottawa) is 15 cases per 100,000 inhabitants per day.
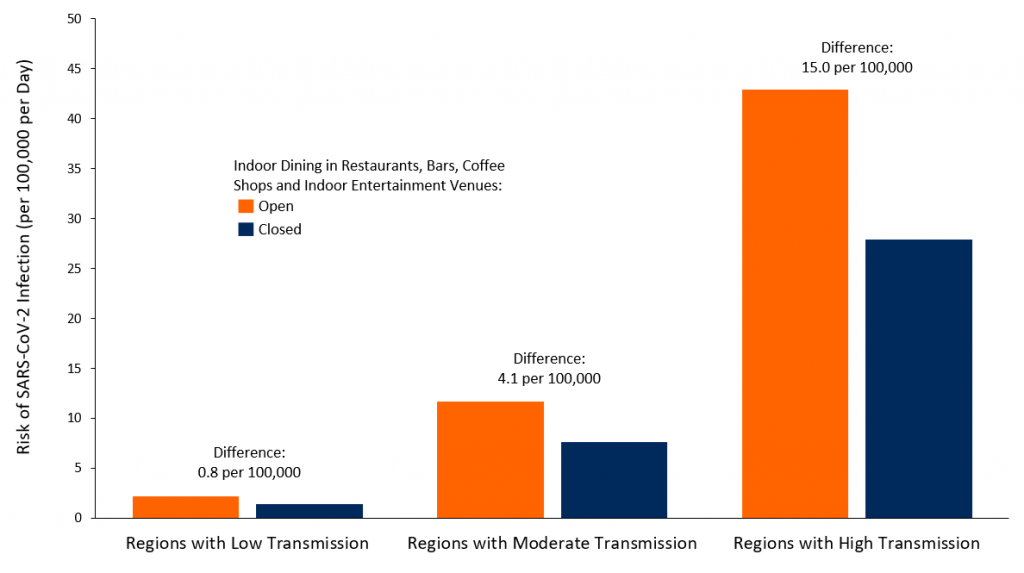
Bar chart representing the risk of SARS-CoV-2 infection per 100,000 people in regions of low, moderate and high rates of transmission. Orange bars represent the risk of SARS-CoV-2 infection per 100,000 persons without any change to current public health measures. Blue bars represent the risk of SARS-CoV-2 infection after the closing of indoor dining in restaurants, bars, coffee shops and indoor entertainment venues where masks cannot be consistently worn and/or physical distancing is difficult to maintain.
In view of the population size of 5.6 million for Toronto, Peel and Ottawa, this difference would translate into an approximate decrease of 800 SARS-CoV-2 infections per day during the first half of the week of October 11, 2020 afforded by the closure of indoor dining in restaurants, bars, coffee shops and indoor entertainment venues. Only about a third of these infections will be reported as active cases, whereas approximately two thirds will remain unreported.
Due to an average incubation period of approximately 5 days1 and a time lag between symptom onset and the confirmation of SARS-CoV-2 infection by PCR test, it will take approximately 10 to 12 days before the impact of the closure of indoor dining in restaurants, bars, coffee shops and indoor entertainment venues on transmission can be observed in the number of confirmed SARS-CoV-2 infections. Since at least two-thirds of SARS-CoV-2 infections will remain undiagnosed despite appropriate testing activity,6 only about a third of the absolute difference will be reported in routine SARS-CoV-2 case statistics.
There is evidence from other jurisdictions that early focused public health interventions may prevent the need for stricter and prolonged public health measures later on. Although cross-country comparisons are invariably complex due to the number of potential confounders, such comparisons can be informative.
Figure 11 shows the incidence of confirmed SARS-CoV-2 infections7 and the stringency of public health measures based on the Oxford COVID-19 government response stringency index in France, Germany, the Netherlands and the state of Victoria, Australia, over time. After the first pandemic wave, Germany maintained moderately stringent public health measures between July and September 2020, which mitigated their second wave until October 5, 2020, and resulted in only moderate epidemic growth. The state of Victoria was more stringent than Germany with its public health measures during the winter months in the Southern hemisphere, which resulted in complete containment of the second wave. In contrast, a lack of stringent measures in France and the Netherlands from July to September 2020 resulted in sustained exponential growth of SARS-CoV-2 infections during the second wave until October 5, 2020. The time lag between the implementation of more stringent public health measures and changes in the slope of the epidemic curves was approximately 10 days in all jurisdictions.
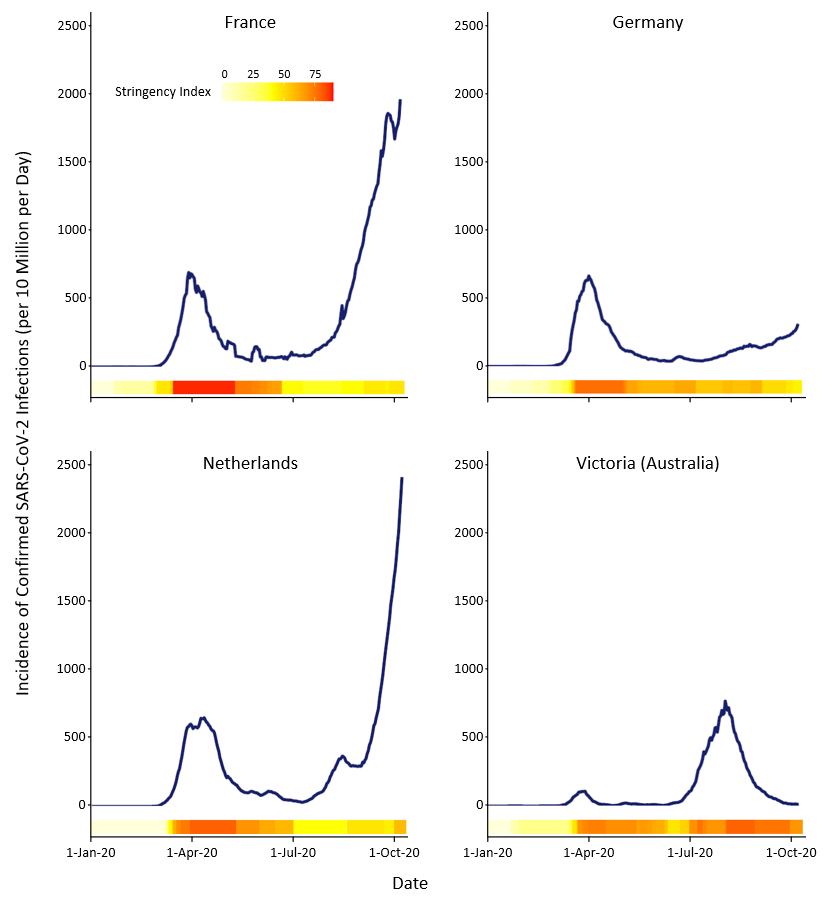
7-day moving averages of confirmed new SARS-CoV-2 infections per 10 million inhabitants per day7 and corresponding Oxford COVID-19 Government Response Stringency Index for and France, Germany, the Netherlands, and the state of Victoria,Australia.8 The stringency index is represented by the horizontal bar; it ranges from bright yellow (0) to red (100), and quantifies the amount and rigor of public health measures implemented in a jurisdiction.
Interpretation
The current slope of Ontario’s second wave and the corresponding projection closely follows the slope of the second wave previously found in the state of Victoria, Australia, which eventually resulted in a strict lockdown.
The percentage of people testing positive is rising quickly at a provincial level in Ontario, with some regions clearly above a 3% test positivity. The pattern of increased test positivity beyond the age group of 20 to 29 years suggests a spread to the older population, which is likely to continue.
There is an increasing number of outbreaks overall, also affecting more vulnerable populations, especially in long-term care homes. The occupancy of acute care and ICU beds with COVID-19 patients has more than doubled since beginning of September 2020. Ontario’s ICU occupancy is predicted to exceed the acceptable threshold of 150 beds within 3 weeks, even in the best-case scenario.
Case growth and spillover to older and more vulnerable populations will critically hinder Ontario’s health system response capacity. A growing number of cases and increasing percent positivity indicate a need for more testing. Given the current testing capacity, this will result in a growing backlog of SARS-CoV-2 tests.
As a consequence of testing backlog, healthcare workers will take longer to clear before returning to work, and patient transfers from hospitals to long-term care homes will take longer as well, resulting in a decreased health care system capacity.
Growing case numbers with clear surges will increase the risk of outbreaks and deaths in long-term care homes, despite increased measures implemented in these settings. A testing backlog will also delay the outbreak response in long-term care homes and other congregate settings.
Growing case numbers and the number of contacts for each case will substantially strain public health capacity for case management and contact tracing, resulting in delays and potential further disease transmission.
Case growth and spillover to older and more vulnerable populations will likely increase COVID-19 mortality and also has the potential of creating a long-term health system burden from COVID-19 long-hauler cases with long-term sequelae.9
It is important to balance the public health and harms of any public health interventions aimed at reducing the transmission of SARS-CoV-2. The current best evidence suggests that early, targeted interventions are likely to curb the increase in SARS-CoV-2 transmission while reducing the need for stricter measures in the future which would have greater consequences.
We therefore recommend that Ontario’s regions with high transmission – Toronto, Peel, and Ottawa – move to a modified Stage 210 in order to reduce the number of contacts and slow transmission.
As new evidence implicates indoor venues in which masks cannot be worn at all times and/or in which physical distancing is difficult to maintain as drivers of community COVID-19 outbreaks and transmission, these venues are the most effective targets for public health interventions. We therefore recommend discontinuing such indoor activities (for example, indoor dining, visits of banquet halls, gyms, bars, clubs and casinos). In addition, people should be encouraged to work from home if possible and to leave home only for essential activities. As the number and extent of school outbreaks have been relatively low until now, schools should be kept open, but further research, such as a phylogenetic study, should elucidate the role of schools in SARS-CoV-2 transmission.11
In regions with moderate SARS-CoV-2 transmission, new public health measures aimed at indoor venues would reduce the risk of SARS-CoV-2 infections to a lesser extent. This benefit must be balanced against the potential harm of restrictions. Overall, an active surveillance approach may be the most prudent in these regions, wherein the incidence of SARS-CoV-2 infections is carefully monitored. If a region reaches more than 25 new SARS-CoV-2 infections per 100,000 people per week, additional targeted public health measures should be introduced.
In regions with low SARS-CoV-2 transmission, the public health benefit of additional restrictions on indoor spaces may not outweigh the consequences. In these regions, the focus should be on encouraging best practices such as physical distancing and wearing masks in public indoor spaces to avoid an increase in SARS-CoV-2 transmission.
In the entire province, irrespective of regional transmission levels, people need to be continuously encouraged to maintain physical distancing, to wear masks in public indoor spaces and outdoors when physical distancing cannot be maintained, and to avoid public and private gatherings.
Methods Used for This Science Brief
We searched PubMed, Google Scholar, the COVID-19 Rapid Evidence Reviews, the Joanna Briggs Institute’s COVID-19 Special Collection, LitCovid in PubMed, the Oxford COVID-19 Evidence Service, the World Health Organization’s Global Literature on Coronavirus Disease, and other COVID-19 specific resources listed by the Guidelines International Network and the McMaster Health Forum for observational studies on the risk of SARS-CoV-2 transmission associated with different settings. In addition, we retrieved reports citing relevant articles through Google Scholar and reviewed references from identified articles for additional studies. The search was last updated on October 8, 2020.
Daily incidence curves were based on 7-day moving averages of confirmed new SARS-CoV-2 infections per day. The prediction of Ontario’s second wave was based on a 14-day doubling time.
For predictions of occupancy of ICU Beds in Ontario according to low, medium and high risk scenarios, we used an individual-level simulation to model the flow of patients with COVID-19 through the hospital system in Ontario as previously described.12 In the low risk scenario, new SARS-CoV-2 infections were assumed to continue to occur predominantly among young and middle aged adults and the risk of hospitalization per SARS-CoV-2 infection were assumed to continue to be similar to the average observed in August and September 2020 in Ontario. The medium risk scenario assumed that new SARS-CoV-2 infections would occur in age groups close to Ontario’s average and that hospitalization rates are similar to the average observed between March and August 2020 in Ontario. For the high risk scenario, new SARS-CoV-2 infections were assumed to occur principally among older adults and hospitalization rates were assumed to be similar to the average observed in March and April 2020 in Ontario.
To derive the 7-day moving averages of confirmed new SARS-CoV-2 infections in regions with high, moderate, and low transmission, we defined regions with high transmission as 25 new SARS-CoV-2 infections per 100,000 people per week during the most recent week of observation (Toronto, Peel, Ottawa); regions with moderate transmission between 5 and 25 new SARS-CoV-2 infections per 100,000 people per week (Kingston, Frontenac and Lennox & Addington, Peterborough, Windsor-Essex, Leeds, Grenville & Lanark, Wellington-Dufferin-Guelph, Brant, Simcoe Muskoka, Durham, Middlesex-London, Hamilton, Niagara, Halton, Eastern Ontario, Waterloo, and York); and regions with low transmission as less than 5 new SARS-CoV-2 infections per 100,000 people per week (all remaining Public Health Units in Ontario).
To apply the results of the U.S. case-control study5 to regions with low, moderate, and high levels of transmission in Ontario during the first half of the week of October 11, 2020, we conservatively assumed that the average doubling time of 14 days applied to all regions in Ontario, that one out of three actual cases of SARS-CoV-2 infection will eventually be detected,6 that 30% of people go to restaurants, bars, and/or coffee shops for indoor dining or drinking, or to an indoor entertainment venue at least once in 2 weeks,5 and that the observed adjusted odds ratio for dining at a restaurant of 2.8 in the U.S. case-control study5 was representative for associations of transmission with indoor dining in restaurants, and visiting bars, coffee shops or indoor entertainment venues in Ontario.
References
1. Lauer SA, Grantz KH, Bi Q, et al. The incubation period of coronavirus disease 2019 (COVID-19) from publicly reported confirmed cases: estimation and application. Ann Intern Med. 2020;172(9):577-582. https://doi.org/10.7326/M20-0504
2. Government of Ontario. Extracts from the integrated Public Health Information System (iPHIS) – Ontario Data Catalogue. Ontario.ca. Published 2020. https://data.ontario.ca/dataset/extracts-from-the-integrated-public-health-information-system-iphis
3. De Villa E. Medical Officer of Health letter: need for enhanced public health measures. City of Toronto. Published October 2, 2020. Accessed October 6, 2020. https://www.toronto.ca/news/medical-officer-of-health-letter-need-for-enhanced-public-health-measures/
4. City of Toronto. COVID-19: status of cases in Toronto. City of Toronto. Published March 31, 2020. Accessed October 6, 2020. https://www.toronto.ca/home/covid-19/covid-19-latest-city-of-toronto-news/covid-19-status-of-cases-in-toronto/
5. Fisher KA, Tenforde MW, Feldstein LR, et al. Community and close contact exposures associated with COVID-19 among symptomatic adults ≥18 years in 11 outpatient health care facilities — United States, July 2020. MMWR Morb Mortal Wkly Rep. 2020;69(36):1258-1264. https://doi.org/10.15585/mmwr.mm6936a5
6. Public Health Ontario. COVID-19 seroprevalence in Ontario: March 27, 2020 to June 30, 2020.; 2020:10. https://www.publichealthontario.ca/-/media/documents/ncov/epi/2020/07/covid-19-epi-seroprevalence-in-ontario.pdf?la=en
7. Roser M, Ritchie H. Coronavirus pandemic (COVID-19). Our World in Data. Published online March 4, 2020. https://ourworldindata.org/coronavirus
8. Blavatnik School of Government, Oxford University. COVID-19 government response stringency index. Published 2020. https://covidtracker.bsg.ox.ac.uk/
9. Marshall M. The lasting misery of coronavirus long-haulers. Nature. 2020;585(7825):339-341. https://doi.org/10.1038/d41586-020-02598-6
10. Government of Ontario. A framework for reopening our province: stage 2. Ontario.ca. Published June 9, 2020. Accessed October 14, 2020. https://www.ontario.ca/page/framework-reopening-our-province-stage-2
11. Jüni P, Maltsev A, Bobos P, et al. The role of children in SARS-CoV-2 transmission. Science Briefs of the Ontario COVID-19 Science Advisory Table. 2020;1(3). https://doi.org/10.47326/ocsat.2020.01.03.1.0
12. Barrett K, Khan YA, Mac S, Ximenes R, Naimark DMJ, Sander B. Estimation of COVID-19–induced depletion of hospital resources in Ontario, Canada. CMAJ. 2020;192(24):E640-E646. https://doi.org/10.1503/cmaj.200715
Document Information & Citation
Author Contributions: PJ, BS and ADB conceived the science brief. PJ, BS, ART, DNF, TG, AG and NS performed analyses. PJ, BS, AO, JM and ADB wrote the first draft of the science brief. All authors contributed to the interpretation of the data, revised the science brief critically for important intellectual content, and approved the final version. PJ and BS contributed equally.
The authors would like to thank Kali Barett, Yasin Khan, Stephen Mac, David Naimark and Raphael Ximenes of the COVID-19 Modelling Collaborative for their contribution to Figures 1, 6 and 7 of this science brief.
Citation: Jüni P, Sander B, Tuite AR, et al. Evidence to support further public health measures in high transmission areas in Ontario. Science Briefs of the Ontario COVID-19 Science Advisory Table. 2020;1(4). https://doi.org/10.47326/ocsat.2020.01.04.1.0
Author Affiliations: The affiliations of the members of the Ontario COVID-19 Science Advisory Table can be found at www.covid19-sciencetable.ca.
Declarations of Interest: The declarations of interest of the members of the Ontario COVID-19 Science Advisory Table can be found at www.covid19-sciencetable.ca.
Copyright: 2020 Ontario COVID-19 Science Advisory Table. This is an open access document distributed under the terms of the Creative Commons Attribution License, which permits unrestricted use, distribution, and reproduction in any medium, provided that the original work is properly cited.
Additional Resources
Evidence to Support Further Public Health Measures in High Transmission Areas in Ontario (Presentation), Ontario COVID-19 Science Advisory Table
Dozens of new infections in Ontario originated from a single gym, The New York Times
As Virus Cases Surge in Europe, Hospitalizations Lag. But for How Long?, The New York Times
CDC Study: Adults With COVID-19 Twice As Likely To Have Dined Out At A Restaurant, Forbes
A Virus Walks Into a Bar…, The New York Times
When It Comes to Covid-19, Most of Us Have Risk Exactly Backward, The New York Times
A room, a bar and a classroom: how the coronavirus is spread through the air, El País