
Key Message
Individuals infected with the provincially and globally dominant SARS-CoV-2 Delta variant demonstrate viral loads that peak sooner after exposure compared to those infected with previous strains of SARS-CoV-2. High SARS-CoV-2 viral loads are likely present before symptoms.
These characteristics make the Delta variant challenging to control; however, they may also improve the performance and expand the practical utility of rapid antigen tests.
In this Science Brief, we determined whether cases with high viral loads/low cycle thresholds are likely to be infectious, and if so, whether rapid antigen tests can reliably detect those cases.
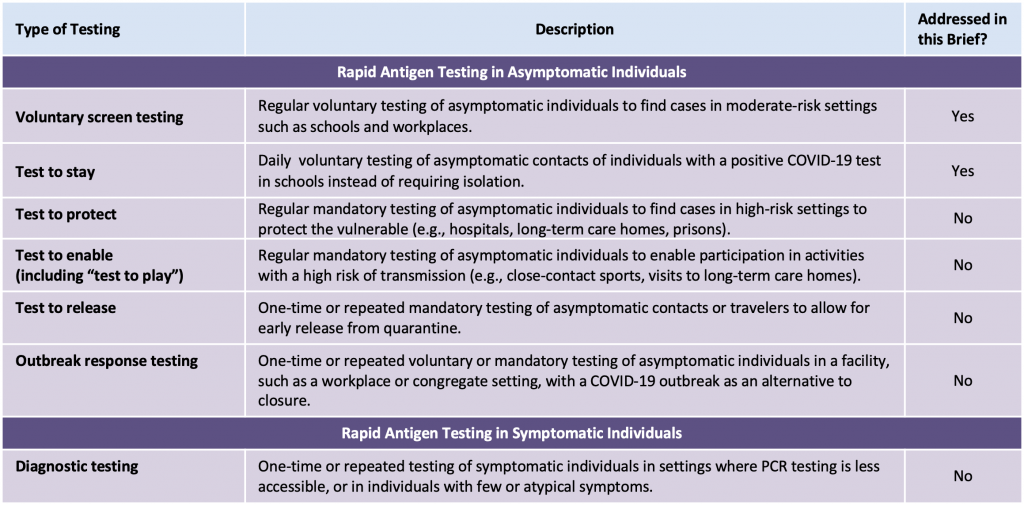
Voluntary screen testing entails regular voluntary testing of asymptomatic individuals to find cases in moderate-risk settings such as schools and workplaces. We found that rapid antigen tests can be a useful tool to reduce transmission in schools when used for voluntary screen testing to identify infectious cases in Public Health Units or neighborhoods using the following thresholds:
Once a Public Health Unit or neighborhood approaches 50 new COVID-19 cases per million per day (corresponding to 35 cases per 100,000 per week) and is in sustained exponential growth, we advise weekly voluntary screen testing of unvaccinated and incompletely vaccinated individuals in elementary schools. Public health units in this situation may also decide to deploy rapid antigen testing in other settings, such as workplaces and congregate settings.
If a Public Health Unit’s or neighborhood’s new daily case rate approaches 250 COVID-19 cases per million per day (corresponding to 175 cases per 100,000 per week), weekly testing is likely not frequent enough to reduce spread effectively. In that case, we advise testing unvaccinated and incompletely vaccinated individuals 2 to 3 times per week. Public health units in this situation may also consider voluntary screen testing of fully vaccinated individuals at the same frequency.
Rapid antigen tests may also present a valuable alternative to individual isolation after exposure in schools. Implementing voluntary “test to stay” protocols, where exposed students remain in school as long as daily tests are negative for SARS-CoV-2, could help prevent the harms of isolation without increasing transmission.
Individuals with positive rapid antigen tests should immediately isolate and undergo confirmatory Polymerase Chain Reaction (PCR) testing. Evaluation of the performance of rapid antigen tests for the diagnosis of the Omicron variant is urgently needed.
Lay Summary
The Delta Variant and Rapid Antigen Tests
Rapid antigen tests identify SARS-CoV-2, the virus that causes COVID-19, in the nose or throat by detecting proteins attached to the surface of the virus (the “antigen”). This approach makes rapid antigen tests different than PCR tests, which determine whether someone is infected with SARS-CoV-2 by amplifying the virus’ genetic material at a lab. Because rapid tests are more easily accessible for many people than PCR tests, can be deployed in a wide range of settings including homes and schools, and produce immediate results, accurate rapid antigen testing could be a useful tool for detecting COVID-19 early and isolating infected people before they have a chance to spread the virus. Understanding the accuracy of rapid antigen tests against the Delta variant, which currently dominates in Ontario, is a key piece of disease control.
This brief establishes the high accuracy of rapid antigen tests in detecting the Delta variant of SARS-CoV-2, which is currently the dominant variant in Ontario. The Delta variant multiples rapidly in the human body, and so the viral load of infected individuals peaks sooner with Delta than with earlier variants, often before symptoms appear. That high viral load at an earlier stage of infection makes the Delta variant more contagious than earlier variants; it is also what makes rapid antigen testing more accurate with Delta than with earlier variants.
Using studies on people carrying a range of SARS-CoV-2 viral loads, we (1) confirmed that people with high viral loads are likely to transmit the virus to the people around them, and (2) established that rapid antigen tests can reliably detect those cases. Rapid antigen tests could therefore help interrupt the chain of transmission by identifying infectious cases of COVID-19 quickly, leading to prompt isolation of the infected person.
Our Advice
Ontario could apply rapid antigen tests in many ways, but this brief focuses on voluntary screen testing: the practice of testing asymptomatic volunteers at regular intervals in settings where there is a moderate risk of transmission, such as schools and workplaces. We considered elementary schools a priority for voluntary screen testing given that students less than 12 years of age are not fully vaccinated in Ontario.
If the COVID-19 case rate in an elementary school’s Public Health Unit or neighborhood approaches 50 cases per million per day (corresponding to 35 cases per 100,000 per week), we recommend that unvaccinated and incompletely vaccinated people be tested once per week. If the COVID-19 case rate approaches 250 cases per million per day (175 cases per 100,000 per week), we recommend that unvaccinated people, and possibly also vaccinated people, be tested 2 to 3 times per week.
We also recommend using a “test to stay” approach in schools for individuals who have been exposed to someone with COVID-19 but do not have symptoms (often referred to as “contacts”). With this approach, contacts are offered daily rapid antigen testing as an alternative to self-isolation, and can continue with in-person learning as long as they test negative and remain asymptomatic for a defined risk period after exposure.
Summary
Background
Delta is currently the predominant variant of the SARS-CoV-2 virus in Ontario and internationally. It is more than twice as transmissible as the wild type virus that caused the first and second waves in Ontario, and 1.5 times as transmissible as the Alpha variant, which caused the third wave. While this early increase in viral load makes transmission of the Delta variant challenging to control, now that it predominates globally, rapid antigen tests may become more sensitive and more useful because of it.
Questions
What is the peak viral load after infection with the Delta variant?
What is the relationship between viral load and transmission?
What is the performance of rapid antigen tests according to viral load or cycle threshold?
How do rapid antigen tests perform in people who are likely to be infectious?
How can rapid tests be used optimally to prevent transmission as well as the negative impacts of testing?
Findings
The Delta variant reliably incites viral loads greater than 100,000 copies/mL (5 log10 units). A higher viral load is reliably associated with a higher probability of transmission: a ten-fold increase in viral load (e.g., from 100,000 copies/mL to 1 million copies/mL) is, on average, associated with a 4.69-fold and 1.33-fold increase in the odds of a positive viral culture and onward transmission of the virus, respectively.
The ability of rapid antigen tests to detect a SARS-CoV-2 infection depends on the viral load of the sample, but diagnostic accuracy studies typically do not quantify viral load directly, and instead report cycle threshold (Ct) values. In subgroups of patients with Ct values of less than 30, the pooled sensitivity for any rapid antigen test and for the Abbott Panbio test (the most commonly used test in Ontario) was 79.9% and 83.4%, respectively. In subgroups of patients with Ct values of less than 25, sensitivity increased to 95.8% for any rapid antigen test, and to 94.1% for the Abbott Panbio test.
The post-test probability of an infectious case after a positive test at 50 cases per 1 million inhabitants per day (corresponding to 35 cases per 100,000 per week) was 25% in unvaccinated individuals, but only 5% in fully vaccinated individuals, which justifies rapid antigen tests only in unvaccinated individuals. However, at a rate of 200 cases per 1 million inhabitants per day, the post-test probability after a positive test was 57% in unvaccinated individuals and 18% in vaccinated individuals, justifying rapid antigen test use in both groups.
If the effective reproduction number (Rt) is consistently above 1.25, or if Rt is around 1 and the rate in a Public Health Unit (or other geographical unit as appropriate) approaches 50 cases per million per day (35 cases per 100,000 per week) and if there is sustained exponential growth, weekly voluntary screen testing of unvaccinated and incompletely vaccinated individuals is recommended in elementary schools. If the rate in a Public Health Unit approaches 250 cases per million per day (175 cases per 100,000 per week), weekly testing is unlikely to sufficiently reduce transmission and testing of unvaccinated and incompletely vaccinated individuals 2 to 3 times per week is required. In this scenario, voluntary screen testing of fully vaccinated individuals at the same frequency should also be considered.
A “test-to-stay” approach with daily rapid testing of school-based contacts appears non-inferior to self-isolation for control of SARS-CoV-2 transmission, with similar rates of symptomatic infections among students and staff with both approaches.
Interpretation
Rapid antigen tests available in Ontario can reliably detect individuals with a viral load greater than 100,000 copies/mL of SARS-CoV-2, who therefore are likely to be infectious. As the viral load of Delta-infected individuals increases earlier in the disease process, these tests likely perform better in the face of the Delta variant compared to previous strains of SARS-CoV-2.
Individuals with positive rapid antigen tests should immediately isolate and undergo confirmatory PCR testing, which will reduce the potential harm of unnecessary prolonged isolation in rare false positive cases, and will also ensure provincial case and contact tracing.
Full Text
Background
Delta is currently the predominant variant of the SARS-CoV-2 virus in Ontario and internationally.1 It is more than twice as transmissible as the wild type virus that caused the first and second waves in Ontario, and 1.5 times as transmissible as the Alpha variant.2 The Delta variant also causes more severe illness than the wild type and the Alpha variant.3 While the Omicron variant appears to spread more quickly than Delta, as of December 7, 2021 Delta remains dominant in Ontario. The effectiveness of rapid antigen testing in detecting Omicron also remains unclear, and needs to be studied urgently. This brief thus does not include any evidence or recommendations regarding rapid antigen testing for the Omicron variant.
The increased transmissibility of the Delta variant compared to previous strains can be partially explained by the viral load trajectory after infection. Figure 1 shows the progression of viral load in individuals infected with the delta variant compared to the wild type virus. Within the first four days after exposure, the viral load of the Delta variant increases considerably faster and peaks sooner than the wild type virus,4,5 typically producing a viral load of 100,000 copies/mL (5 log10 units) only one to two days after exposure.
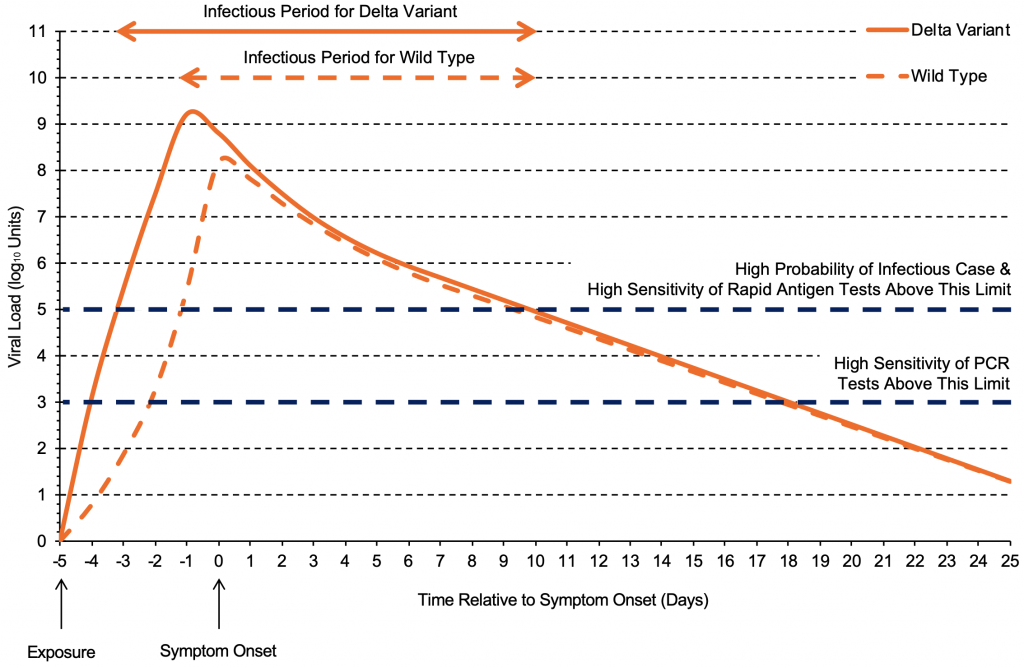
The viral load of the Delta variant increases quickly and reaches its peak earlier than the wild type virus,4 typically producing a viral load of 100,000 copies/mL (5 log10 units) one to two days after exposure. After reaching the peak viral load, the trajectories are likely similar between the two variants. Each log10 unit corresponds to a 10-fold increase in viral load (copies/mL). Graph based on data from Li et al4 and Kang et al.5
While this early increase in viral load makes transmission of the Delta variant challenging to control, now that it predominates in Ontario and internationally, rapid antigen tests may become more sensitive and more useful because of it.6–8 Consistent with this concept, Bekliz et al recently found that rapid antigen tests are sufficiently sensitive to detect variants of concern, including the Delta variant.9 Rapid antigen tests might be particularly useful for voluntary screen testing, which entails regular voluntary testing of asymptomatic individuals to find cases in moderate-risk settings such as schools and workplaces (Box 1). This Science Brief will only discuss voluntary screen testing and test to stay strategies, as indicated in the Box below.
Adapted from Crozier et al.8
In this Science Brief, we assessed the usefulness of rapid antigen testing through a sequence of questions derived from the following logic. Rapid antigen tests detect proteins attached to the surface of a virus. PCR, the established gold standard for testing, identifies the virus by replicating its genetic material through enough cycles to make it detectable; the fewer cycles that are necessary to make viral material detectable, the more viral material there is. The number of cycles needed to surpass this threshold of detection is called cycle threshold. In this Science Brief, we assessed whether cases with high viral loads/low cycle thresholds are likely to be infectious, and if so, whether rapid antigen tests can reliably detect those cases.
Questions
What is the peak viral load after infection with the Delta variant?
What is the relationship between viral load and transmission?
What is the performance of rapid antigen tests according to viral load or cycle threshold?
How do rapid antigen tests perform in people who are likely to be infectious?
How can rapid tests be used optimally to prevent transmission as well as the negative impacts of testing?
Findings
Peak Viral Load after Infection with the Delta Variant
Figure 2 presents the peak viral load observed in 45 individuals infected with the Delta variant who underwent daily testing after exposure. A total of 43 individuals had peak viral loads greater than 100,000 copies/mL (5 log10 units), and 41 individuals (91.1%) had peak viral loads greater than 1 million copies/mL (6 log10 units).10The Delta variant therefore reliably incites high viral loads greater than 100,000 copies/mL.
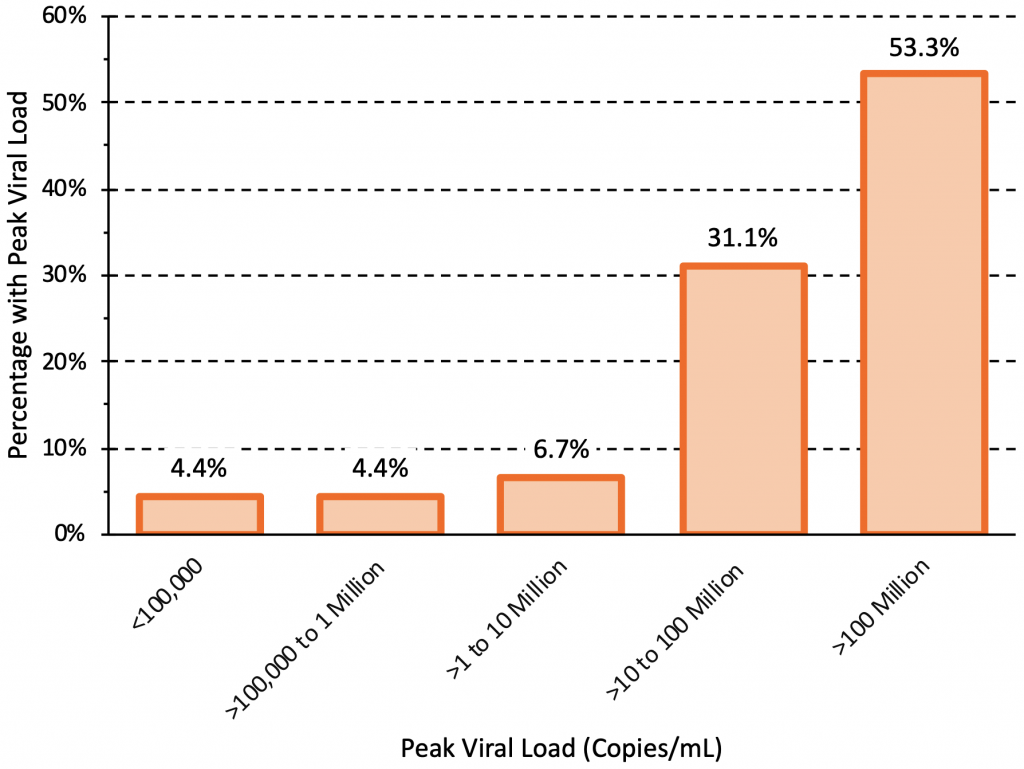
45 individuals infected with the Delta variant who underwent daily testing after exposure were included. 16 individuals were unvaccinated and 29 were fully vaccinated. The peak viral loads were similar between unvaccinated and fully vaccinated individuals, but viral load declined faster in vaccinated individuals after reaching the peak. A total of 43 individuals had peak viral loads greater than 100,000 copies/mL (5 log10 units), and 41 individuals (91.1%) had peak viral loads greater than 1 million copies/mL (6 log10 units). Data from Singanayagam et al.10
Relationship between Viral Load and Transmission
In the sections above, we established that Delta carries a higher viral load at an earlier stage of infection than other variants. If rapid antigen tests can reliably detect cases with a high viral load, then it is important to know if those are the cases that are likely to be infectious. Here, we determine whether a high viral load is associated with a higher probability of transmission.
Table 1 presents the results of the seven identified studies that estimated the association between viral load and the odds of a positive viral culture for the wild type virus and Alpha variant.11–17 A positive viral culture suggests viable virus that can potentially be transmitted to others. Conversely, a negative culture implies low transmission potential, as no viable virus could be grown.
The median odds ratio per log10 increase in viral load was 4.69, indicating that a ten-fold increase in viral load (e.g., from 100,000 copies/mL to 1 million copies/mL) is associated with a 4.69-fold increase in the odds of a positive viral culture, on average. Results were consistent across studies, with the exception of those reported by Korenkov et al, which suggested a considerably stronger relationship between viral load and the odds of a positive culture.12
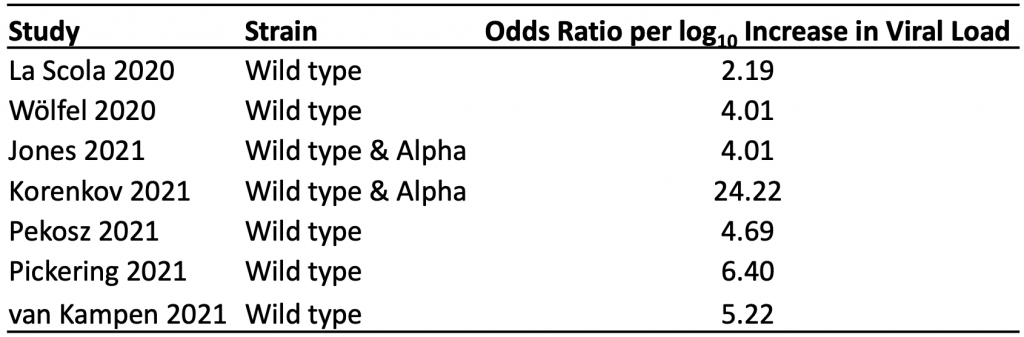
The median odds ratio per log10 increase in viral load was 4.69, indicating that on average, a ten-fold increase in viral load (e.g., from 100,000 copies/mL to 1 million copies/mL) is associated with a 4.69-fold increase in the odds of a positive viral culture. A positive viral culture suggests viable virus that can be transmitted to others.
Six of the seven identified studies were suitable for inclusion in a meta-analysis of the probability of a positive viral culture by viral load. At a viral load of 10,000 copies/mL (4 log10 units), there was little variation between estimates, resulting in a pooled probability of a positive culture of 0.2% (Figure 3). The probability increased alongside viral load, with higher variation between studies at a viral load of 10 million copies/mL (7 log10 units) or more. At the maximum viral load of 1 billion copies/mL, the pooled probability of a positive culture was 92.5%.
Table 2 presents the results of five identified studies that estimated the association between viral load and the odds of transmission, mainly for the wild type virus and Alpha variant.18–22 The association for the Delta variant was consistent.22 The median odds ratio per log10 increase in viral load in any setting, or within a non-household setting, was 1.33, indicating that, on average, a ten-fold increase in viral load (e.g., from 100,000 copies/mL to 1 million copies/mL) is associated with a 1.33-fold increase in the odds of transmission. The only study that assessed the association in a household setting specifically found an odds ratio of 1.77 per log10increase in viral load.19 Since there is less variation in the exposure of contacts in household settings, this stronger association is expected.
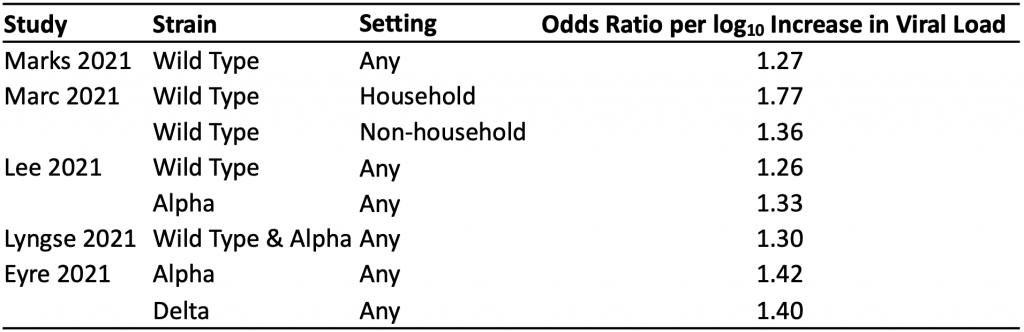
The median odds ratio per log10 increase in viral load in any setting, or within a non-household setting, was 1.33, indicating that a ten-fold increase in viral load (e.g., from 100,000 copies/mL to 1 million copies/mL) is associated with a 1.33-fold increase in the odds of transmission, on average. The only study that assessed the association in a household setting specifically found an odds ratio of 1.77 per log10 increase in viral load.19
Figure 4 shows the estimated relationship between viral load and the probability of positive culture, the probability of transmission in households, and the probability of transmission in any setting, based on the studies included in Tables 1 and 2. The association with viral load was strong in all three cases. Below a viral load of 1 million copies/mL (6 log10 units), the estimated probability of transmission is higher than the estimated probability of a positive culture, which may be due to the timing of sampling: individuals with viral loads below 1 million copies/mL who caused transmission may not have been sampled at their peak viral load. Regardless, a high viral load appears to be associated with a higher probability of positive viral culture and onward transmission for the wild type virus and the Alpha variant, and this relationship likely also holds true for the Delta variant.
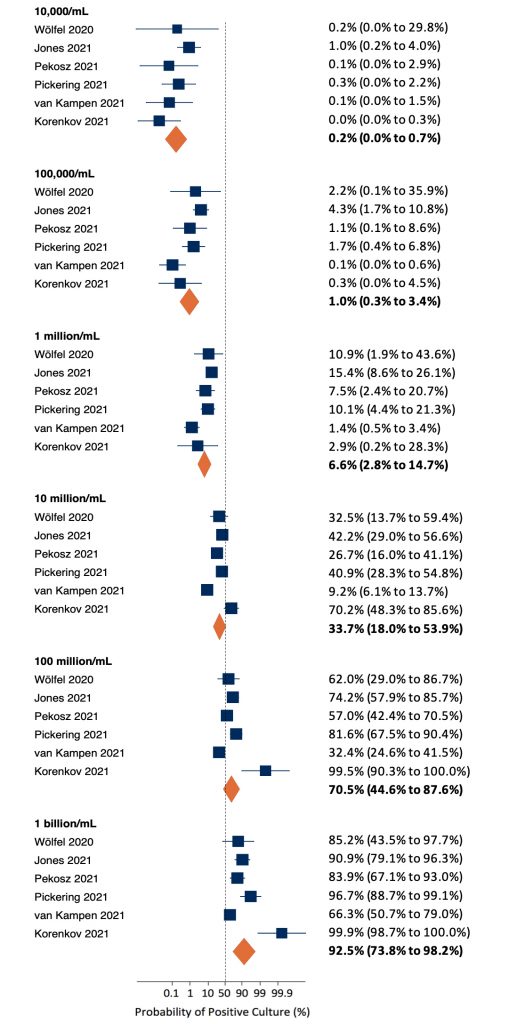
At a viral load of 10,000 copies/mL (4 log10 units), there was little variation between estimates, resulting in a pooled probability of a positive culture of 0.2%. The probability increased alongside viral load, with higher variation between studies at a viral load of 10 million copies/mL (7 log10 units) or more. At the maximum viral load of 1 billion copies/mL, the pooled probability of a positive culture was 92.5%.
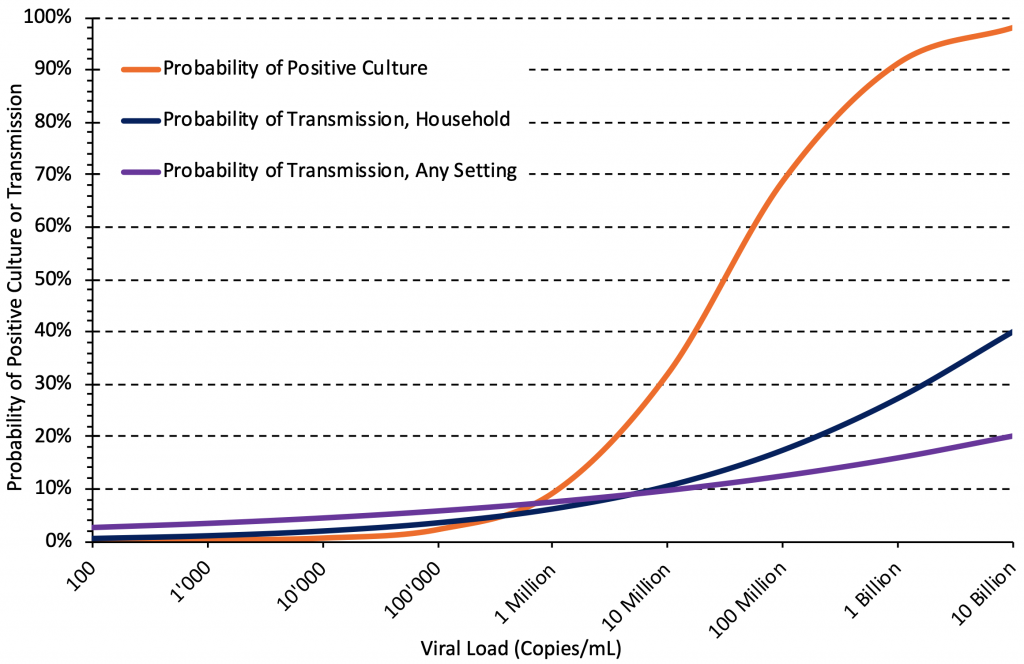
There are strong associations between viral load and the probability of positive culture, the probability of transmission in household settings, and the probability of transmission in any setting. Median estimates of the associations were taken from Tables 1 and 2, the association for household settings is from Marc et al.19
Performance of Rapid Antigen Tests According to Viral Load and Cycle Threshold
Having established that Delta is characterized by early, high viral loads and that a higher viral load is associated with a higher probability of cultured virus and transmission, we assessed whether rapid antigen tests are effective at detecting infections in people with early, high viral loads that appear to drive Delta’s transmission. Below, we relate the detection of SARS-CoV-2 by rapid antigen tests with minimum cycle threshold (Ct) values found in PCR tests.
Table 3 presents the estimated sensitivity of the Abbott Panbio rapid antigen test at different viral loads based on logistic regression, and the corresponding Ct values as reported by Peto et al.23 The Abbott Panbio test is the most commonly used test in Ontario.24 A higher viral load is associated with a lower PCR Ct value, as less amplification of the viral genetic material in the sample is needed to reach the threshold for detection.
At a viral load of 100,000 copies/mL (corresponding to a Ct value of 25.0 according to a single study by Peto et al),23 the estimated sensitivity of the Abbott Panbio test was 84.3%. At a viral load of 1 million copies/mL (corresponding to a Ct value of 21.5), the estimated sensitivity was 94.1%. At 100 million copies/mL, which corresponds to the peak viral load in more than 50% of the 45 people studied in Figure 2, the estimated sensitivity was 99.3%.
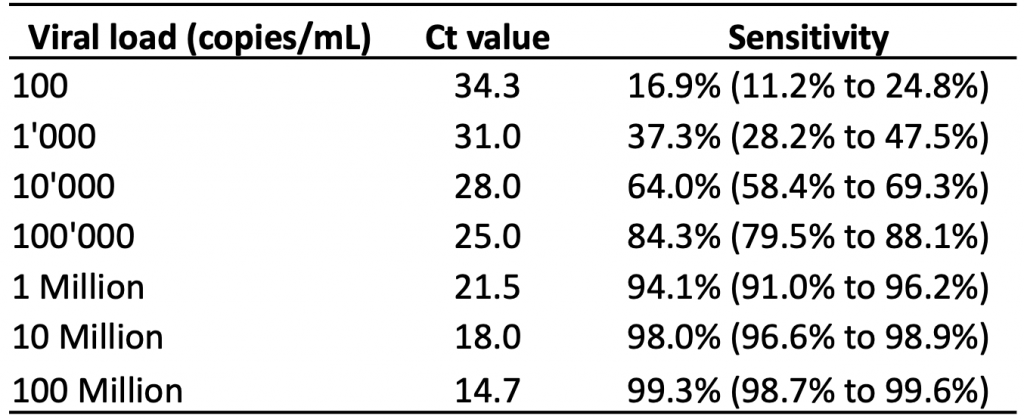
Estimated sensitivity of the Abbott Panbio rapid antigen test based on 99 dry-swab community samples collected by health care workers and laboratory scientists. The rapid antigen tests were performed by laboratory scientists. Estimates at each log10 unit of viral load (100 copies/mL to 100 million copies/mL) were derived from a logistic regression model. Ct, cycle threshold. Data from Peto et al.23
Diagnostic accuracy studies typically do not quantify viral load directly, but instead report Ct values. This enabled Brümmer et al to include subgroup analyses by Ct value in a living systematic review and meta-analysis.6 Table 4 presents the pooled sensitivity by Ct value for rapid antigen tests overall and for the Abbott Panbio test specifically.
In subgroups of patients with Ct values of less than 30, the pooled sensitivity for any rapid antigen test and for the Abbott Panbio test was 79.9% and 83.4%, respectively. In subgroups of patients with Ct values of less than 25, sensitivity increased to 95.8% for any rapid antigen test, and to 94.1% for the Abbott Panbio test. As expected, pooled sensitivities for patients with Ct values ≥30 or ≥25 were considerably lower.
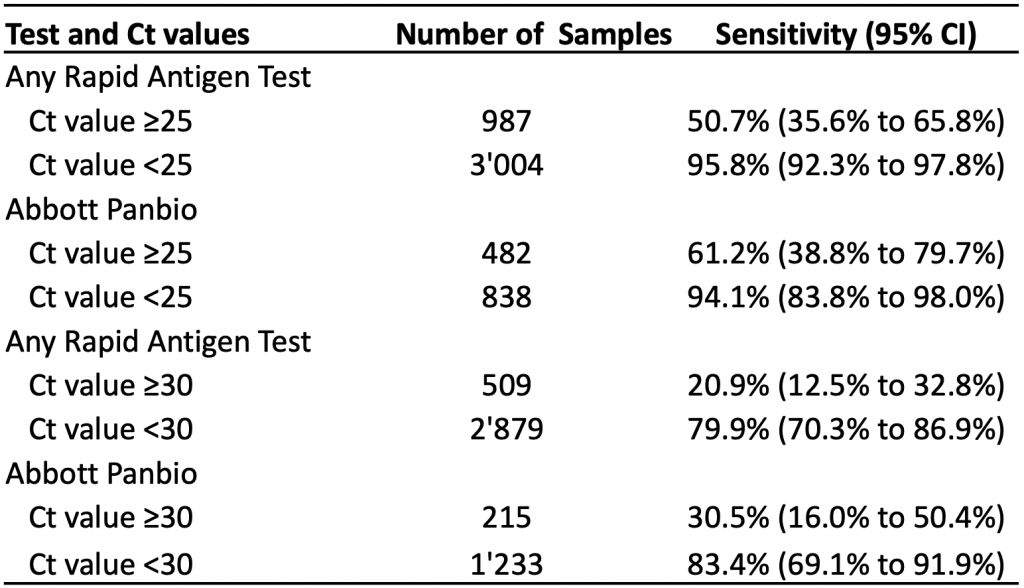
At Ct values of <30, the pooled sensitivity is 79.9% for all rapid antigen tests combined and 83.4% for the Abbot Panbio test. Lower Ct values are associated with higher viral loads. Ct, cycle threshold. Data from Brümmer et al.6
We are aware of four rapid antigen tests currently available in Ontario: Abbott Panbio, BD Veritor, Quidel Sofia and BTNX Rapid Response. Pooled specificities reported by Brümmer et al for Abbott Panbio, BD Veritor and Quidel Sofia were 99.4%, 99.5%, and 99.1%, respectively.6 The manufacturer of the BTNX Rapid Response test reported a specificity of 100%.25 There are many rapid antigen tests available globally, and their sensitivity can vary widely;26 however, the tests available in Ontario are all sufficiently sensitive and specific to be useful.
Relationship between Cycle Threshold (Ct) Values and Viral Load
In the course of establishing that rapid antigen tests are effective in detecting cases with high viral loads, we now assess the variation in the reported relationship between Ct values and actual viral loads. This relationship is established at the level of the laboratory performing the PCR tests during test calibration. Our assessment allows us to define a maximum Ct value, that may be used to identify the subgroup of people with SARS-CoV-2 infections that should be analyzed to estimate the diagnostic performance of rapid antigen tests when detecting infectious cases.
The relationship between Ct value and viral load depends on the type of assay, the RNA primer and the calibration process. Figure 5 shows the estimated range of Ct values at a viral load of 100,000 Copies/mL from 42 identified standard curves.12–14,20,22,23,27–43 The median Ct value at this viral load was 25.82 (interquartile range 23.03 to 29.27), with 46% of Ct values below 25, and 83% below 30.
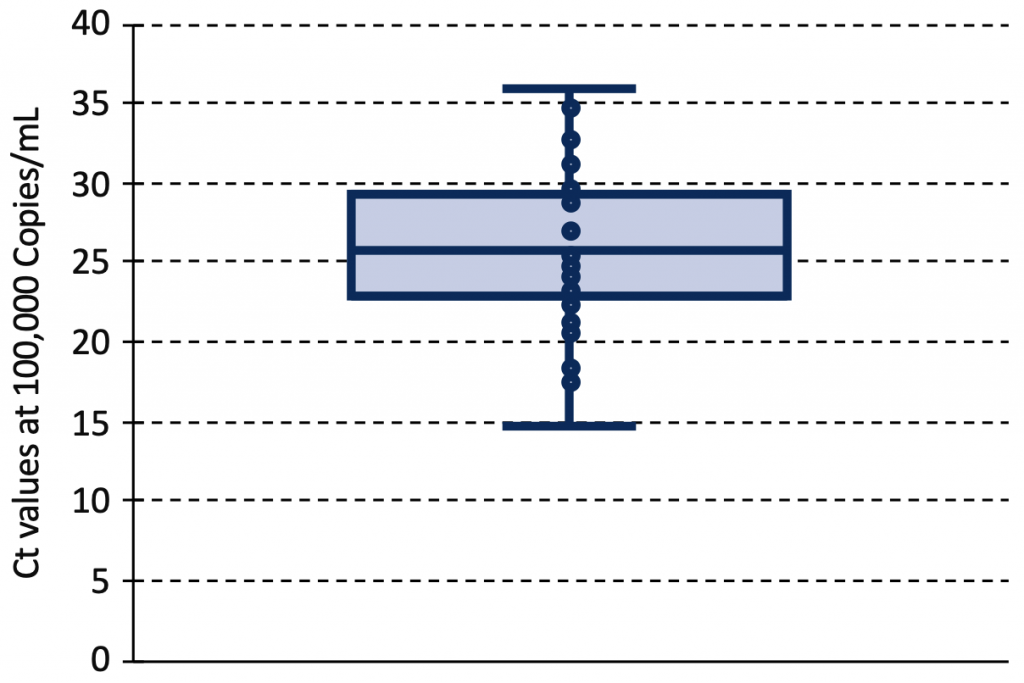
Box and Whisker plot of Ct values at a viral load of 100,000 Copies/mL from 42 identified PCR standard curves reported in 23 original articles.12–14,20,22,23,27–43 The median Ct value at this viral load was 25.82 (interquartile range 23.03 to 29.27). Ct, cycle threshold.
Figure 6 shows the cumulative distribution of viral loads at a Ct value of 30 from the same 42 standard curves used to produce Figure 5. At a Ct value of 30, the median viral load was 5,400 copies/mL (interquartile range 500 to 60,000 copies/mL), and an estimated 83% of assays reported viral loads below 100,000 copies/mL at this threshold.
The pooled sensitivity estimates provided by Brümmer et al6 for the subgroup of patients with Ct values below 30 can therefore be used to produce conservative estimates of the diagnostic performance of rapid antigen tests when detecting infectious cases with viral loads of 100,000 copies/mL or more.
Ability of Rapid Antigen Tests to Detect or Rule Out Infectious Cases
In the previous sections, we established that rapid antigen tests can detect the high viral loads that characterize an early Delta infection, and that these high viral loads are associated with the likelihood of transmission. We also established that samples with a Ct value of less than 30 can be used to conservatively estimate the ability of rapid antigen tests to detect or rule out with reasonable certainty currently infectious cases. Here, we return to the patient themselves to assess the probability of being an infectious case after a positive or negative rapid antigen test, taking into account case rates in the community or a Public Health Unit, and the individual’s vaccination status.
Figure 7 presents the number of COVID-19 cases per 1 million inhabitants per day in Ontario by vaccination status. The case numbers are currently five to six times greater in unvaccinated individuals compared to fully vaccinated individuals, which means that the pre-test probability of SARS-CoV-2 infection is also five to six times greater in the unvaccinated population. The results of a rapid antigen test should therefore always be interpreted taking the individual’s vaccination status into consideration.
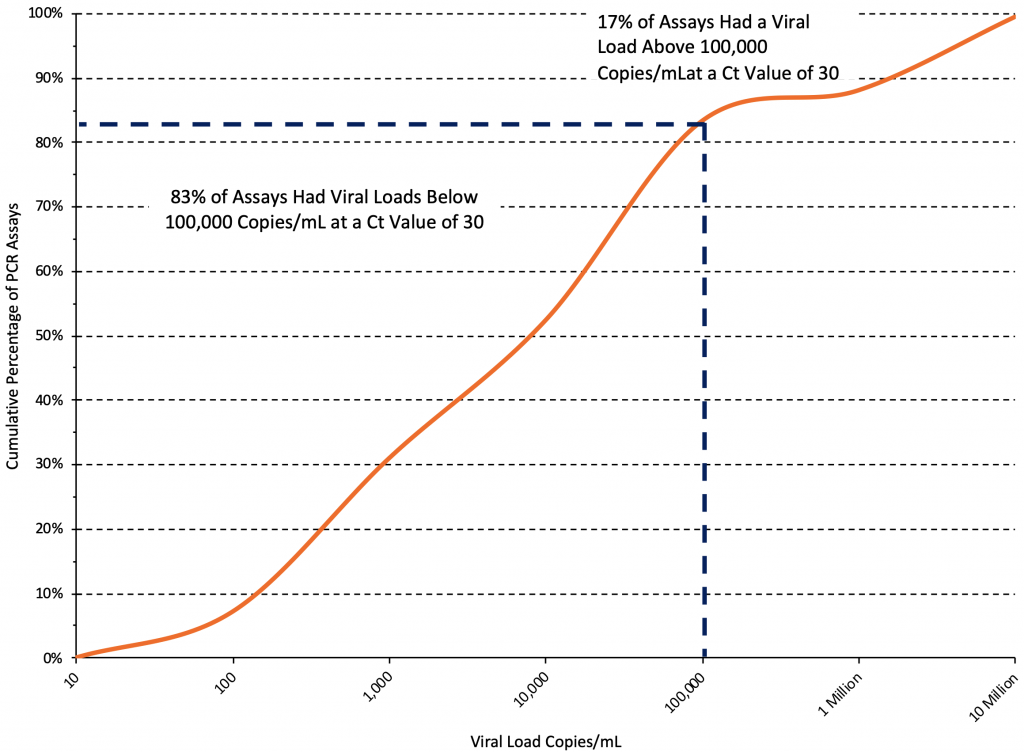
Cumulative distribution curve derived from 42 PCR standard curves reported in 23 original articles.12–14,20,22,23,27–43 At a Ct value of 30, the median viral load was 5,400 copies/mL, and an estimated 83% of assays reported viral loads below 100,000 copies/mL at this threshold. Ct, cycle threshold.
The most conservative pooled estimate of the sensitivity of rapid antigen tests for detecting an infectious case reported by Brümmer et al is 79.9% in patients with Ct values less than 30. The most conservative pooled estimate of specificity (reported for the Quidel Sofia test) is 99.1%.6 We feel that our estimates of sensitivity are conservative, and would account for the lower test sensitivity that occurs when the test is performed by a lay person instead of a professional, such as a laboratory scientist or health worker.23 These estimates can be used to calculate likelihood ratios for a positive or negative test result, which depend on sensitivity and specificity.
The likelihood ratio for a positive test result specifies how much more likely it is to obtain a positive test result in an infectious case compared to someone who is not infected or unlikely to be infectious.44 Using the aforementioned sensitivity and specificity, the positive likelihood ratio is 0.799/(1-0.991)=88.8, indicating that the test has the power to confidently rule in an infectious case.
The likelihood ratio for a negative test result indicates how much less likely it is to obtain a negative result in a potentially infectious case compared to someone who is not infected or unlikely to be infectious.44 Using the aforementioned sensitivity and specificity, the negative likelihood ratio is (1-0.799)/ 0.991=0.20, which is low enough to be clinically relevant and have the power to rule out an infectious case.
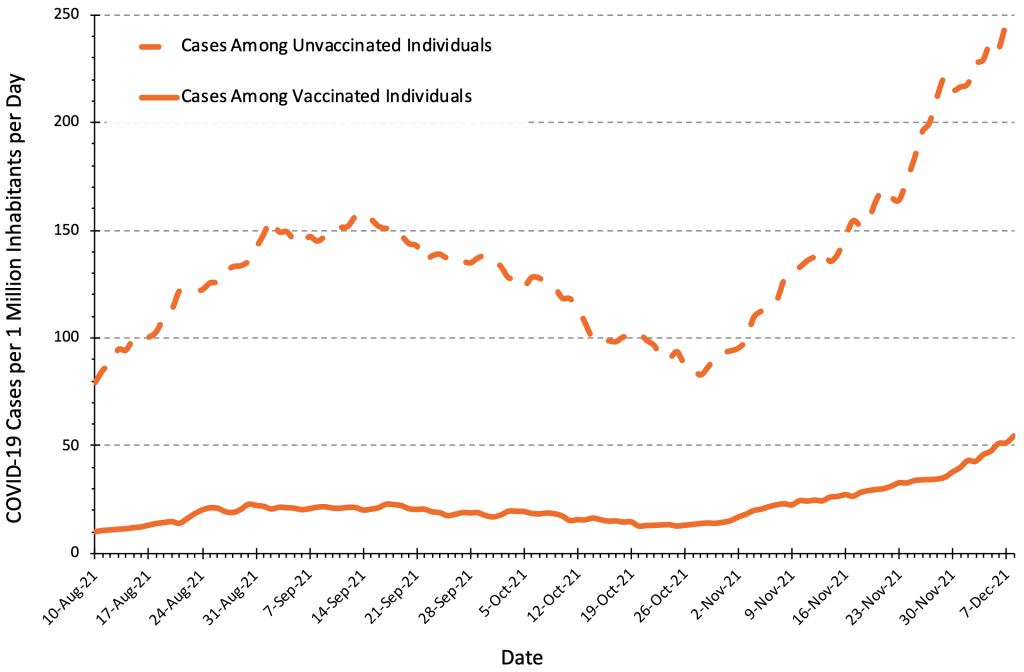
The number of COVID-19 Cases per 1 million inhabitants per day in unvaccinated people is currently 4 to 6 times higher than in fully vaccinated people, which needs to be taken into account when interpreting results of rapid antigen tests. Figure adapted from Ontario Dashboard.1
Figure 8 presents the relationship between the daily rate of COVID-19 cases in Ontario and the post-test probability of an infectious case after a positive or negative rapid antigen test. The post-test probability is influenced by the pre-test probability, and the test result (positive vs. negative) and by the likelihood ratio of the rapid antigen test being used.
Unvaccinated people have a higher pre-test probability of disease, and therefore have a higher probability of being an infectious case after both a positive or a negative test compared to vaccinated people. This information is relevant to decisions about rapid antigen test use. For example, the post-test probability of an infectious case after a positive test at 50 cases per 1 million inhabitants per day (corresponding to 740 cases per day in Ontario, or to 35 cases per 100,000 per week) is 25% in unvaccinated individuals, but only 5% in fully vaccinated individuals, which justifies rapid antigen tests only in unvaccinated individuals. However, at a rate of 200 cases per 1 million inhabitants per day (140 cases per 100,000 per week), the post-test probability after a positive test is 57% in unvaccinated individuals and 18% in vaccinated individuals, justifying rapid antigen test use in both groups. Individuals with positive rapid antigen tests should immediately isolate and undergo confirmatory PCR testing. The post-test probability of an infectious case after a negative test is always below 1% when the rate is below 600 cases per 1 million inhabitants per day (420 cases per 100,000 per week).
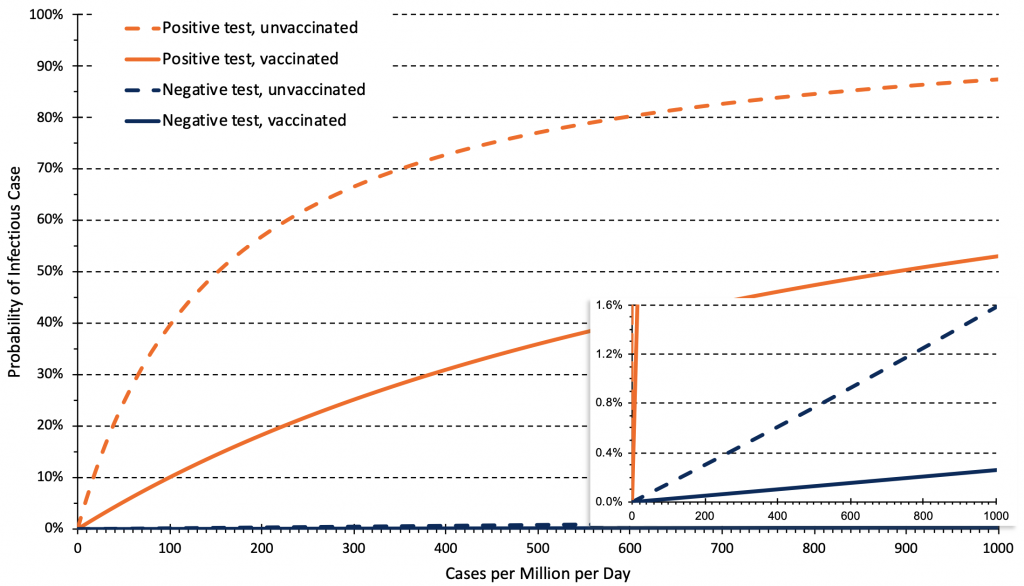
Relationship between the daily rate of COVID-19 cases in Ontario and post-test probability of an infectious case after a negative or positive rapid antigen test for unvaccinated and vaccinated people. Estimates are based on 14-day averages of the relationship between overall rates, and rates in unvaccinated and vaccinated individuals as of November 21, 2021. This relationship can change over time depending on vaccine coverage and immunity afforded by full vaccination. The rate of cases per million per day needs to be multiplied by 0.7 to derive a rate of cases per 100,000 per week, e.g., 50 cases per million per day correspond to 35 cases per 100,000 per week.
Frequency of Voluntary Screen Testing
Having established the value of rapid antigen testing as a screening test, we can now ask when and how Public Health Units should deploy them to control the spread of Delta and possibly other variants.
Figure 9 presents different epidemiological and testing scenarios modelled by Paltiel et al for unvaccinated college students,45 suggesting that the rate of COVID-19 cases and the effective reproduction number (Rt) in the community dictates testing frequency. Scenario A assumed a rate of 40 COVID-19 cases per million per day in the community and moderate exponential growth with an Rt of 1.5. Scenario B assumed 80 cases per million per day in the community, and high exponential growth with an Rt of 2.5. Scenario C assumed 200 cases per million per day in the community, and explosive exponential growth with an Rt of 3.5.
Rapid antigen tests can be used as a tool to reduce transmission when they identify infectious cases of COVID-19 quickly and lead to prompt isolation of the infected person. In scenario A, weekly testing resulted in an 84% reduction of COVID-19 cases, with only small reductions in transmission with further increases in the frequency of testing. However, in scenario B, the increase in frequency from once to twice a week resulted in a further 22% reduction in cases, which could justify more frequent testing. In scenario C, weekly testing was insufficient to reduce transmission; testing should be performed 2 to 5 times per week.
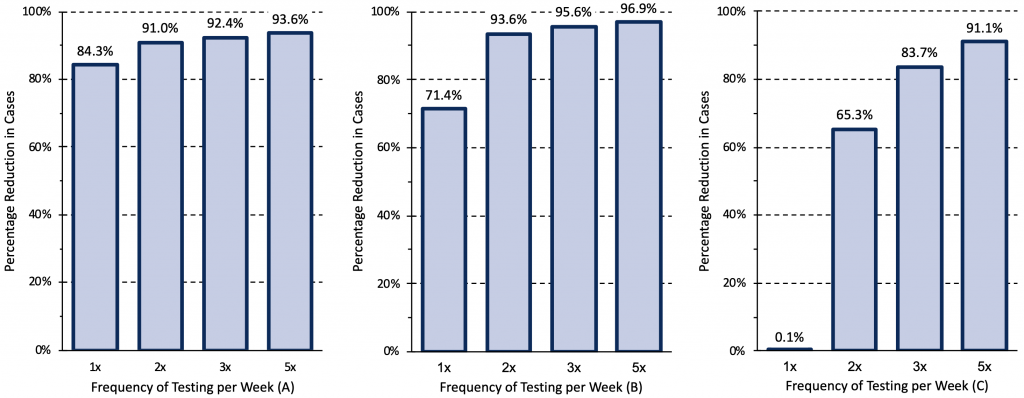
Relative reduction in COVID-19 cases afforded by different frequencies of rapid antigen testing for three epidemiological scenarios. Modelling was based on a hypothetical cohort of 5000 unvaccinated college students followed for 80 days when the wild type virus was dominant. Scenario A assumed a rate of 40 COVID-19 cases per million per day introduced in the college from the community and moderate exponential growth with an effective reproduction number (Rt) of 1.5. Scenario B assumed 80 cases per million per day, and high exponential growth with an Rt of 2.5. Scenario C assumed 200 cases per million per day, and explosive exponential growth with an Rt of 3.5. In scenario C, weekly testing is clearly insufficient to reduce transmission, indicating that, in comparable situations, testing should be performed 2 to 5 times per week. Data from Paltiel et al.45
Suggested Indications for Rapid Antigen Testing
Figure 10 presents the suggested indications for rapid antigen testing as a function of COVID-19 case rates and Rt. If Rt is consistently above 1.25, or if Rt is around 1 and the rate in a Public Health Unit, neighborhood or other geographical unit as appropriate approaches 50 cases per million per day (35 cases per 100,000 per week), or if there is sustained exponential growth, weekly voluntary screen testing of unvaccinated and incompletely vaccinated individuals is recommended in elementary schools. Elementary schools are a priority for voluntary screen testing given that students less than 12 years of age are not yet fully vaccinated, but other settings, such as high schools, post-secondary schools, workplaces and congregate settings, may also benefit from its implementation. If the rate in a Public Health Unit or neighborhood approaches 250 cases per million per day (175 cases per 100,000 per week), weekly testing is unlikely to sufficiently reduce transmission and testing of unvaccinated and incompletely vaccinated individuals 2 to 3 times per week is required. In this scenario, voluntary screen testing of fully vaccinated individuals at the same frequency should also be considered. The usefulness of voluntary screen testing as a tool to reduce transmission will eventually depend on community participation; high uptake will increase its effectiveness.
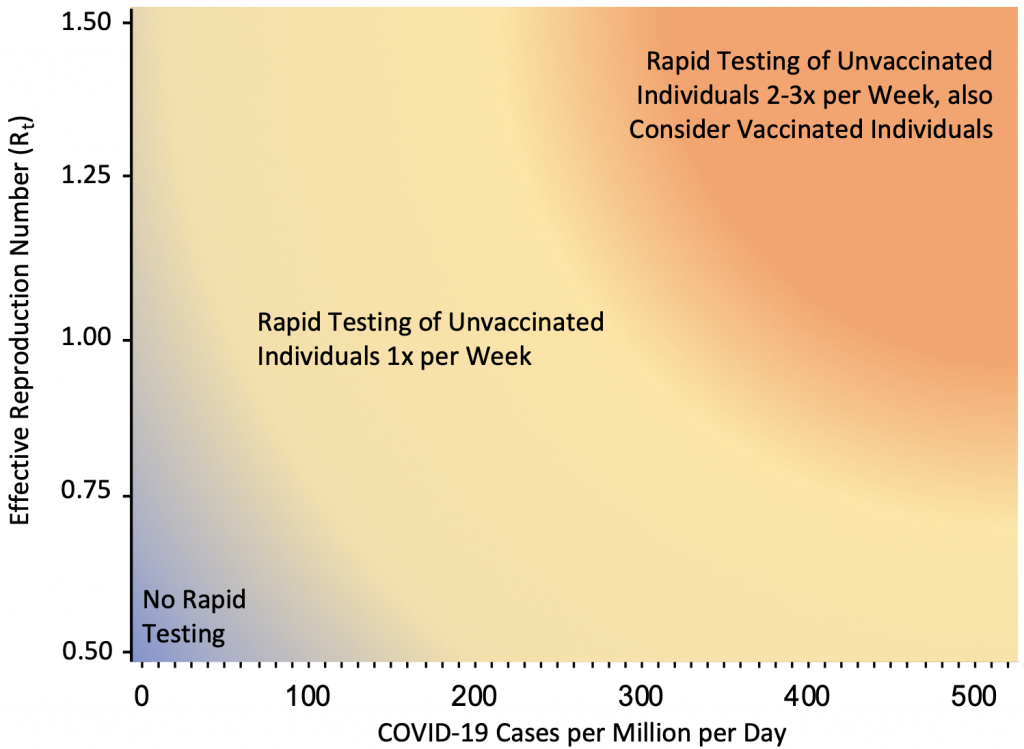
If Rt is consistently above 1.25, or if Rt is around 1 and the community rate approaches 50 cases per million per day (corresponding to 35 cases per 100,000 per week), or if there is exponential growth, weekly voluntary screen testing of unvaccinated and incompletely vaccinated individuals is recommended in elementary schools, and potentially in other settings. If the community rate approaches 250 cases per million per day (175 cases per 100,000 per week), weekly testing is unlikely to sufficiently reduce transmission and testing of unvaccinated and incompletely vaccinated individuals 2 to 3 times per week is required. In this scenario, voluntary screen testing of fully vaccinated individuals at the same frequency should also be considered. Rt, effective reproduction number.
Figure 11 presents the rate of COVID-19 cases per 1 million inhabitants per day across Public Health Units in Ontario as of December 7, 2021. There is currently a nearly 25-fold difference in the rates of COVID-19 cases between the most- and-least affected Public Health Units. According to the criteria outlined in Figure 10, Public Health Units approaching 250 cases per million per day should offer rapid antigen testing in elementary schools at least twice a week. In Public Health Units with sustained rates above 50 cases per million per day, rapid antigen testing should be implemented in elementary schools once a week. Volunteer screen testing with rapid antigen tests should be instituted promptly in the Public Health Units with the highest rates.
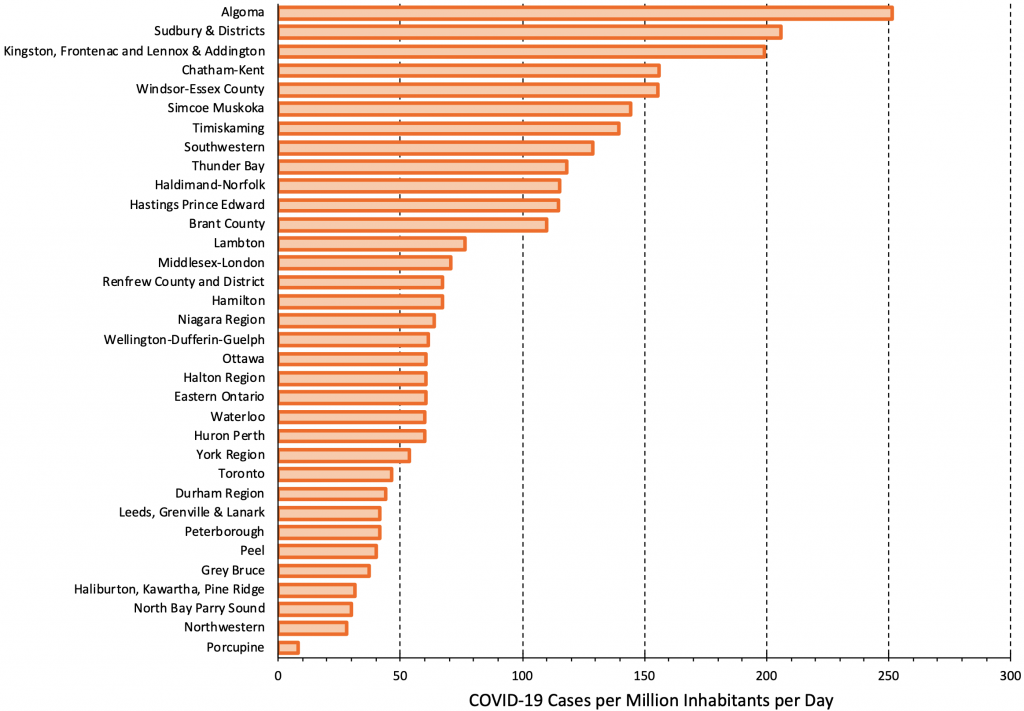
There is currently a nearly 25-fold difference in rates of COVID-19 cases between most and least affected Public Health Units. Figure adapted from Ontario Dashboard.1
Test to Stay Approach
Rapid antigen tests are a potentially useful alternative to isolation following exposure to a SARS-CoV-2-infected individual, particularly in schools. A randomized cluster trial performed in England by Young et al found no difference in rates of SARS-CoV-2 infections in staff and students between schools that offered daily rapid antigen testing to close contacts of cases, and schools that used self-isolation to manage close contacts when COVID-19 case rates were low to moderate.46
The trial took place over a 10-week period between April and June of 2021, before the Delta variant predominated, and randomly allocated participating schools to two groups. 102 schools with approximately 112,000 students and 12,000 staff offered daily rapid antigen testing to close contacts as an alternative to self-isolation. 99 schools with 103,000 students and 12,000 staff were assigned to the control: mandatory 10-day self-isolation after close contact with a case. 42% of the contacts of cases in the intervention group consented to daily testing as an alternative to self-isolation. The study reported 59.1 infections per 100,000 person-weeks at risk in the control group and 61.8 infections per 100,000 person-weeks at risk in the intervention group, for an adjusted incidence rate ratio of 0.96 (95% CI 0.75–1.22). The authors concluded that daily rapid testing of school-based contacts was non-inferior to self-isolation for control of SARS-CoV-2 transmission, with similar rates of symptomatic infections among students and staff with both approaches. Using a “test to stay” approach could therefore allow in-person learning of those who do test negative to continue whenever possible, minimizing the harm of voluntary screen testing and isolation of contacts of detected cases.
Interpretation
Rapid antigen tests available in Ontario can reliably detect individuals with a viral load greater than 100,000 copies/mL of SARS-CoV-2, who therefore are likely to be infectious (see Figure 1). As the viral load of Delta-infected individuals increases earlier in the disease process, these tests likely perform better in the face of the Delta variant compared to previous strains of SARS-CoV-2.
Rapid antigen tests, when used for voluntary screen testing to identify asymptomatic infectious cases at specific thresholds, can be a useful tool to reduce transmission in schools and other settings. If the rate in a Public Health Unit approaches 50 COVID-19 cases per million per day (corresponding to 35 cases per 100,000 per week), weekly voluntary screen testing of unvaccinated and incompletely vaccinated individuals is recommended in elementary schools, and potentially in other settings.
If the rate in a Public Health Unit approaches 250 COVID-19 cases per million per day (corresponding to 175 cases per 100,000 per week), weekly testing is unlikely to sufficiently reduce transmission and testing of unvaccinated and incompletely vaccinated individuals 2 to 3 times per week is required. In this scenario, voluntary screen testing of fully vaccinated individuals should also be considered.
It is important to note that while rapid tests may help with earlier detection of Delta variant cases, they are not sufficient for controlling spread. Successful implementation of a rapid testing program relies on ensuring that supports are in place for all related activities, including distribution, case and contact tracing and lab-based testing, results management, and education. This brief does not address the additional challenges associated with implementation.
Individuals with positive rapid antigen tests should immediately isolate and undergo confirmatory PCR testing, which will reduce the potential harm of unnecessary prolonged isolation in rare false positive cases, and will also ensure provincial case and contact tracing. The recommended thresholds were derived based on the assumptions outlined in this Science Brief and can serve as a guidance for Public Health Units. Evaluation of the performance of rapid antigen tests for the diagnosis of the Omicron variant is urgently needed.47
Methods Used for This Science Brief
We searched PubMed, Google Scholar, the COVID-19 Rapid Evidence Reviews, the Joanna Briggs Institute’s COVID-19 Special Collection, LitCovid in PubMed, the Oxford COVID-19 Evidence Service, the World Health Organization’s Global Literature on Coronavirus Disease, and other COVID-19 specific resources listed by the Guidelines International Network and the McMaster Health Forum. In addition, we retrieved reports citing relevant articles through Google Scholar and reviewed references from identified articles for additional studies. The search was last updated on November 18, 2021.
The COVID-19 Evidence Synthesis Network performed a research evidence scan for this Science Brief, published in an Evidence Synthesis Briefing Note.48 The COVID-19 Evidence Synthesis Network is comprised of organizations in Ontario’s evidence synthesis and knowledge translation community who collectively provide high-quality, relevant, and timely synthesized research evidence about COVID-19. The Methods for the evidence scan can be found in the methods section of the Briefing Note.
We performed a random-effects meta-analysis of the probability of a positive viral culture by viral load. The relationship between the rate of cases per million inhabitants per day and the post-test probability after a positive or negative rapid antigen test in unvaccinated and vaccinated individuals was estimated based on pre-test probabilities, which were a function of rates of diagnosed cases. We transformed these probabilities into pre-test odds, multiplied the pre-test odds with likelihood ratios to derive post-test odds, and back-transformed these post-test odds into post-test probabilities. To derive pre-test probabilities we assumed that 40% of actual SARS-CoV-2 infections were diagnosed in Ontario; that diagnosed cases would remain active and contributed to community transmission for an average of 6 days, while undiagnosed cases contributed to community transmission for an average of 10 days; and that the average rate of COVID-19 cases would need to be multiplied by a factor of 3.5 to estimate the rate in unvaccinated individuals, and by 0.6 to estimate the rate in vaccinated individuals. These factors corresponded to the mean of observed multiplication factors of 3.5 (standard deviation 0.1) for unvaccinated and 0.6 (standard deviation 0.02) for vaccinated individuals during the previous 30 days.
References
1. Jüni P, Maltsev A, Katz GM, Perkhun A, Yan S, Bodmer NS. Ontario Dashboard. Sci Briefs Ont COVID-19 Sci Advis Table. Published online January 1, 2021. https://doi.org/10.47326/ocsat.dashboard.2021.1.0
2. Tuite AR, Fisman DN, Odutayo A, et al. COVID-19 hospitalizations, ICU admissions and deaths associated with the new variants of concern. Sci Briefs Ont COVID-19 Sci Advis Table. 2021;1(18). https://doi.org/10.47326/ocsat.2021.02.18.1.0
3. Fisman DN, Tuite AR. Evaluation of the relative virulence of novel SARS-CoV-2 variants: A retrospective cohort study in Ontario, Canada. CMAJ Can Med Assoc J J Assoc Medicale Can. 2021;193(42):E1619-E1625. https://doi.org/10.1503/cmaj.211248
4. Li B, Deng A, Li K, et al. Viral infection and transmission in a large well-traced outbreak caused by the Delta SARS-CoV-2 variant. medRxiv. Published online 2021. https://doi.org/10.1101/2021.07.07.21260122
5. Kang M, Xin H, Yuan J, et al. Transmission dynamics and epidemiological characteristics of Delta variant infections in China.; medRxiv. 2021:2021.08.12.21261991. https://doi.org/10.1101/2021.08.12.21261991
6. Brümmer LE, Katzenschlager S, Gaeddert M, et al. Accuracy of novel antigen rapid diagnostics for SARS-CoV-2: A living systematic review and meta-analysis. PLoS Med. 2021;18(8):e1003735. https://doi.org/10.1371/journal.pmed.1003735
7. Mina MJ, Peto TE, García-Fiñana M, Semple MG, Buchan IE. Clarifying the evidence on SARS-CoV-2 antigen rapid tests in public health responses to COVID-19. Lancet. 2021;397(10283):1425-1427. https://doi.org/10.1016/S0140-6736(21)00425-6
8. Crozier A, Rajan S, Buchan I, McKee M. Put to the test: Use of rapid testing technologies for covid-19. BMJ. 2021;372. https://doi.org/10.1136/bmj.n208
9. Bekliz M, Adea K, Essaidi-Laziosi M, et al. SARS-CoV-2 antigen-detecting rapid tests for the delta variant. Lancet Microbe. Published online November 24, 2021. https://doi.org/10.1016/S2666-5247(21)00302-5
10. Singanayagam A, Hakki S, Dunning J, et al. Community transmission and viral load kinetics of the SARS-CoV-2 Delta (B.1.617.2) variant in vaccinated and unvaccinated individuals in the UK: A prospective, longitudinal, cohort study. Lancet Infect Dis. Published online October 29, 2021. https://doi.org/10.1016/S1473-3099(21)00648-4
11. La Scola B, Le Bideau M, Andreani J, et al. Viral RNA load as determined by cell culture as a management tool for discharge of SARS-CoV-2 patients from infectious disease wards. Eur J Clin Microbiol Infect Dis. 2020;39(6):1059-1061. https://doi.org/10.1007/s10096-020-03913-9
12. Korenkov M, Poopalasingam N, Madler M, et al. Evaluation of a rapid antigen test to detect SARS-CoV-2 infection and identify potentially infectious individuals. J Clin Microbiol. 2021;59(9). https://doi.org/10.1128/JCM.00896-21
13. Pekosz A, Parvu V, Li M, et al. Antigen-based testing but not real-time polymerase chain reaction correlates with Severe Acute Respiratory Syndrome Coronavirus 2 viral culture. Clin Infect Dis. Published online January 20, 2021. https://doi.org/10.1093/cid/ciaa1706
14. Pickering S, Batra R, Merrick B, et al. Comparative performance of SARS-CoV-2 lateral flow antigen tests and association with detection of infectious virus in clinical specimens: A single-centre laboratory evaluation study. Lancet Microbe. 2021;2(9). https://doi.org/10.1016/S2666-5247(21)00143-9
15. van Kampen JJA, van de Vijver DAMC, Fraaij PLA, et al. Duration and key determinants of infectious virus shedding in hospitalized patients with coronavirus disease-2019 (COVID-19). Nat Commun. 2021;12(1):267. https://doi.org/10.1038/s41467-020-20568-4
16. Wölfel R, Corman VM, Guggemos W, et al. Virological assessment of hospitalized patients with COVID-2019. Nature. 2020;581(7809):465-469. https://doi.org/10.1038/s41586-020-2196-x
17. Jones TC, Biele G, Mühlemann B, et al. Estimating infectiousness throughout SARS-CoV-2 infection course. Science. 2021;373(6551). https://doi.org/10.1126/science.abi5273
18. Marks M, Millat-Martinez P, Ouchi D, et al. Transmission of COVID-19 in 282 clusters in Catalonia, Spain: A cohort study. Lancet Infect Dis. 2021;21(5):629-636. https://doi.org/10.1016/S1473-3099(20)30985-3
19. Marc A, Kerioui M, Blanquart F, et al. Quantifying the relationship between SARS-CoV-2 viral load and infectiousness. Cobey SE, Van der Meer JW, eds. eLife. 2021;10. https://doi.org/10.7554/eLife.69302
20. Lee LY, Rozmanowski S, Pang M, et al. SARS-CoV-2 infectivity by viral load, S gene variants and demographic factors and the utility of lateral flow devices to prevent transmission. medRxiv. Published online April 5, 2021. https://doi.org/10.1101/2021.03.31.21254687
21. Lyngse FP, Mølbak K, Frank KT, Nielsen C, Skov RL, Kirkeby CT. Association between SARS-CoV-2 transmission risk, viral load, and age: A nationwide study in Danish households. medRxiv; 2021. https://doi.org/10.1101/2021.02.28.21252608
22. Eyre DW, Taylor D, Purver M, et al. The impact of SARS-CoV-2 vaccination on Alpha and Delta variant transmission. medRxiv. Published online 2021. https://www.medrxiv.org/content/10.1101/2021.09.28.21264260v2
23. Peto T, Affron D, Afrough B, et al. COVID-19: Rapid antigen detection for SARS-CoV-2 by lateral flow assay: A national systematic evaluation of sensitivity and specificity for mass-testing. EClinicalMedicine. 2021;36. https://doi.org/10.1016/j.eclinm.2021.100924
24. Public Health Agency of Canada. Testing for COVID-19: Increasing testing supply. Published October 6, 2020. https://www.canada.ca/en/public-health/services/diseases/2019-novel-coronavirus-infection/symptoms/testing/increased-supply.html
25. BTNX Inc. Rapid response: COVID-19 antigen rapid test device product insert (COV-19C25).; 2021. https://www.alberta.ca/assets/documents/covid-19-btnx-rapid-test-device-manual.pdf
26. Scheiblauer H, Filomena A, Nitsche A, et al. Comparative sensitivity evaluation for 122 CE-marked rapid diagnostic tests for SARS-CoV-2 antigen, Germany, September 2020 to April 2021. Eurosurveillance. 2021;26(44):2100441. https://doi.org/10.2807/1560-7917.ES.2021.26.44.2100441
27. Bal A, Brengel-Pesce K, Gaymard A, et al. Clinical and laboratory characteristics of symptomatic healthcare workers with suspected COVID-19: A prospective cohort study. Sci Rep. 2021;11(1):14977. https://doi.org/10.1038/s41598-021-93828-y
28. Berg MG, Zhen W, Lucic D, et al. Development of the RealTime SARS-CoV-2 quantitative laboratory developed test and correlation with viral culture as a measure of infectivity. J Clin Virol Off Publ Pan Am Soc Clin Virol. 2021;143:104945. https://doi.org/10.1016/j.jcv.2021.104945
29. Ferguson J, Dunn S, Best A, et al. Validation testing to determine the sensitivity of lateral flow testing for asymptomatic SARS-CoV-2 detection in low prevalence settings: Testing frequency and public health messaging is key. PLoS Biol. 2021;19(4):e3001216. https://doi.org/10.1371/journal.pbio.3001216
30. García-Fiñana M, Hughes DM, Cheyne CP, et al. Performance of the Innova SARS-CoV-2 antigen rapid lateral flow test in the Liverpool asymptomatic testing pilot: population based cohort study. BMJ. 2021;374:n1637. https://doi.org/10.1136/bmj.n1637
31. Schuit E, Veldhuijzen IK, Venekamp RP, et al. Diagnostic accuracy of rapid antigen tests in asymptomatic and presymptomatic close contacts of individuals with confirmed SARS-CoV-2 infection: Cross sectional study. BMJ. 2021;374. https://doi.org/10.1136/bmj.n1676
32. Hay JA, Kennedy-Shaffer L, Kanjilal S, Lipsitch M, Mina MJ. Estimating epidemiologic dynamics from single cross-sectional viral load distributions. medRxiv. Published online October 13, 2020:2020.10.08.20204222. https://doi.org/10.1101/2020.10.08.20204222
33. Chan JFW, Yip CCY, To KKW, et al. Improved molecular diagnosis of COVID-19 by the novel, highly sensitive and specific COVID-19-RdRp/Hel real-time reverse transcription-PCR assay validated in vitro and with clinical specimens. J Clin Microbiol. 2020;58(5). https://doi.org/10.1128/JCM.00310-20
34. Pilarowski G, Lebel P, Sunshine S, et al. Performance characteristics of a rapid severe Severe Acute Respiratory Syndrome Coronavirus 2 antigen detection assay at a Public Plaza testing site in San Francisco. J Infect Dis. 2021;223(7):1139-1144. https://doi.org/10.1093/infdis/jiaa802
35. Saraiello A, Ferrentino F, Cuomo N, et al. Correlation between cycle threshold and viral load through comparison of RT-PCR qualitative versus quantitative assay for SARS-CoV-2. Microbiol Medica. 2021;36(2). https://doi.org/10.4081/mm.2021.9999
36. Zou L, Ruan F, Huang M, et al. SARS-CoV-2 viral load in upper respiratory specimens of infected patients. N Engl J Med. 2020;382(12):1177-1179. https://doi.org/10.1056/NEJMc2001737
37. Walker AS, Pritchard E, House T, et al. Ct threshold values, a proxy for viral load in community SARS-CoV-2 cases, demonstrate wide variation across populations and over time. Teare MD, Davenport MP, eds. eLife. 2021;10. https://doi.org/10.7554/eLife.64683
38. Kohmer N, Toptan T, Pallas C, et al. The comparative clinical performance of four SARS-CoV-2 rapid antigen tests and their correlation to infectivity in vitro. J Clin Med. 2021;10(2):328. https://doi.org/10.3390/jcm10020328
39. Chu DKW, Pan Y, Cheng SMS, et al. Molecular diagnosis of a novel Coronavirus (2019-nCoV) causing an outbreak of pneumonia. Clin Chem. 2020;66(4):549-555. https://doi.org/10.1093/clinchem/hvaa029
40. Arnaout R, Lee RA, Lee GR, et al. The limit of detection matters: The case for benchmarking Severe Acute Respiratory Syndrome Coronavirus 2 testing. Clin Infect Dis Off Publ Infect Dis Soc Am. 2021;73(9). https://doi.org/10.1093/cid/ciaa1382
41. Sonnleitner ST, Dorighi J, Jansen B, et al. An in vitro model for assessment of SARS-CoV-2 infectivity by defining the correlation between virus isolation and quantitative PCR value: Isolation success of SARS-CoV-2 from oropharyngeal swabs correlates negatively with Cq value. Virol J. 2021;18(1):71. https://doi.org/10.1186/s12985-021-01542-y
42. Yu F, Yan L, Wang N, et al. Quantitative detection and viral load analysis of SARS-CoV-2 in infected patients. Clin Infect Dis. 2020;71(15):793-798. https://doi.org/10.1093/cid/ciaa345
43. Huang CG, Lee KM, Hsiao MJ, et al. Culture-based virus isolation to evaluate potential infectivity of clinical specimens tested for COVID-19. J Clin Microbiol. 2020;58(8). https://doi.org/10.1128/JCM.01068-20
44. Jaeschke R, Guyatt GH, Sackett DL. Users’ guides to the medical literature. III. How to use an article about a diagnostic test. B. What are the results and will they help me in caring for my patients? The Evidence-Based Medicine Working Group. JAMA. 1994;271(9):703-707. https://doi.org/10.1001/jama.271.9.703
45. Paltiel AD, Zheng A, Walensky RP. Assessment of SARS-CoV-2 screening strategies to permit the safe reopening of college campuses in the United States. JAMA Netw Open. 2020;3(7):e2016818. https://doi.org/10.1001/jamanetworkopen.2020.16818
46. Young BC, Eyre DW, Kendrick S, et al. Daily testing for contacts of individuals with SARS-CoV-2 infection and attendance and SARS-CoV-2 transmission in English secondary schools and colleges: An open-label, cluster-randomised trial. Lancet. 2021;398(10307). https://doi.org/10.1016/S0140-6736(21)01908-5
47. Callaway E. Heavily mutated Omicron variant puts scientists on alert. Nature. Published online November 25, 2021. https://doi.org/10.1038/d41586-021-03552-w
48. Evidence Synthesis Unit. Evidence synthesis briefing note: Sensitivity and use of rapid antigen tests for SARS-CoV-2 Delta variant. COVID-19 Evidence Synthesis Network; 2021. https://esnetwork.ca/briefings/sensitivity-use-of-rapid-antigen-tests-for-sars-cov-2-delta-variant/?highlight=rapid%20test
Document Information & Citation
Author Contributions: PJ conceived the Science Brief. PJ and PB performed analyses. PJ and SB performed literature searches and wrote the first draft of the Science Brief. PJ and PB extracted data. All authors revised the Science Brief critically for important intellectual content and approved the final version.
Citation: Jüni P, Baert S, Bobos P, et al. Rapid antigen tests for voluntary screen testing. Science Briefs of the Ontario COVID-19 Science Advisory Table. 2021;2(52). https://doi.org/10.47326/ocsat.2021.02.52.1.0
Author Affiliations: The affiliations of the members of the Ontario COVID-19 Science Advisory Table can be found at https://covid19-sciencetable.ca/.
Declarations of Interest: The declarations of interest of the members of the Ontario COVID-19 Science Advisory Table, its Working Groups, or its partners can be found at https://covid19-sciencetable.ca/. The declarations of interest of external authors can be found under Additional Resources.
Copyright: 2021 Ontario COVID-19 Science Advisory Table. This is an open access document distributed under the terms of the Creative Commons Attribution License, which permits unrestricted use, distribution, and reproduction in any medium, provided that the original work is properly cited.
The views and findings expressed in this Science Brief are those of the authors and do not necessarily reflect the views of all of the members of the Ontario COVID-19 Science Advisory Table, its Working Groups, or its partners.